 RSS Feed
 by Calculated Risk on 3/11/2012 09:36:00 AM
Sunday, March 11, 2012
AAR: Rail Traffic "mixed" in February
From the Association of American Railroads (AAR): AAR Reports Mixed Results for February Rail Traffic
The Association of American Railroads (AAR) today reported U.S. rail carloads originated in February 2012 totaled 1,410,992, down 27,555 carloads or 1.9 percent, compared with February 2011. Intermodal volume in February 2012 was 1,122,458 containers and trailers, up 26,284 units or 2.4 percent compared with February 2011. February’s average of 224,492 intermodal units per week was the third highest ever for a February for U.S. railroads.
...
“If you exclude carloads of coal and grain, which are down for reasons that have little to do with the state of the economy, rail traffic in February was encouraging,” said AAR Senior Vice President John T. Gray. “Intermodal traffic was up for the 27th straight month, while carloads of a wide range of commodities—lumber, chemicals, petroleum, paper, steel and more—saw increases in February. Time will tell, but we’re hopeful it’s a sign of broad-based improvement in economic conditions.”
 Click on graph for larger image.
This graph shows U.S. average weekly rail carloads (NSA).
U.S. rail carloads totaled 1,410,992 in February 2012 (the five weeks ending March 3), down 1.9% (27,555 carloads) from the same period in 2011.According to the AAR, the decline in coal is because coal is being used less for electricity generation.
...
Coal was the main problem in February. U.S. railroads originated 592,316 carloads of coal in February 2012, down 70,583 carloads (10.6%) from February 2011. That’s the biggest year-over-year monthly percentage decline for coal since January 2010. U.S. rail carloads excludingcoal were up 5.5% (43,028 carloads) in February 2012 over February 2011.
The second graph is for intermodal traffic (using intermodal or shipping containers):
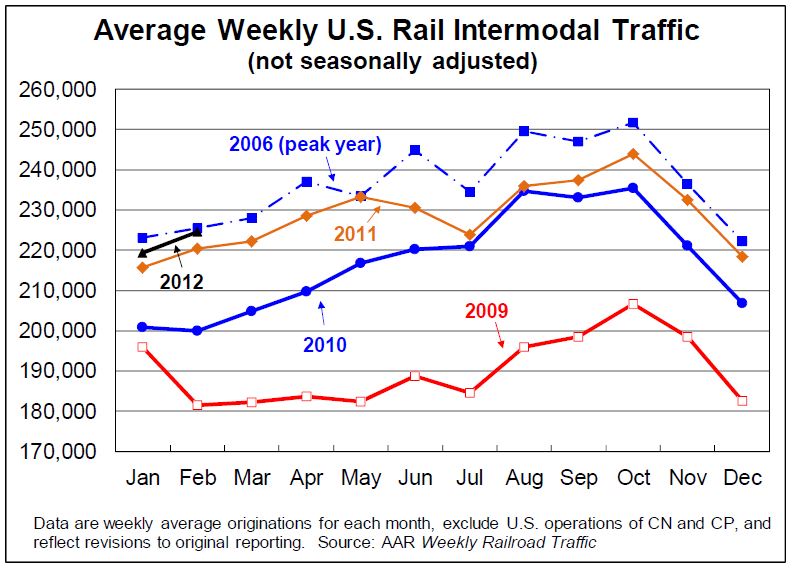 Graphs reprinted with permission.
Intermodal traffic is close to the peak year in 2006.
U.S. rail intermodal volume in February 2012 was 1,122,458 containers and trailers, up 2.4% (26,284 units) over February 2011 on a non-seasonally adjusted basis and the 27th straight year-over-year monthly increase. February’s average of 224,492 intermodal units per week was the third highest ever for a February for U.S. railroads (behind 2006 and 2007). Intermodal growth continues to be a function of increased globalization; the conversion of domestic all-truck to intermodal rail movements; better service due to more terminals and improved infrastructure; and other factors.
Yesterday:
• Summary for Week ending March 9th
• Schedule for Week of March 11th


