by Calculated Risk on 12/19/2011 07:40:00 PM
Monday, December 19, 2011
Credit Stress Indicators
There are several possible channels of contagion from the European financial crisis.
The most obvious is the trade channel. A recession in Europe will negatively impact U.S. exports. Although Europe is a major U.S. trading partner, exports only make up a small portion of U.S. GDP. Also some of the impact from trade would probably be offset by lower oil prices – and of course lower interest rates as investors seek safety (the European crisis is a key reason the U.S. 10 year bond yield is at 1.81%).
A more significant channel would be tightening of U.S. credit conditions in response to the European crisis. That is why I looked so closely at the Fed’s October Senior Loan Officer Opinion Survey on Bank Lending Practices that was released in November. The survey showed “considerable” tightening on lending to European banks, and some tightening to European firms, but the survey showed no tightening in the U.S. (although lending standards are already pretty tight).
There are other possible channels of contagion, such as less European lending to emerging markets and a slowdown in those economies – and then fewer exports from the U.S. to those emerging markets. But the most significant channel will probably be credit stress. Here are a few indicators of credit stress:
• The three month LIBOR has increased:
Data from the British Bankers' Association showed the three-month dollar London Interbank Offered Rate, or Libor, was higher at 0.56695% from 0.56315% Friday. ... The spread between the three-month dollar Libor and overnight index swaps, a barometer of market stress, widened to 48.1 basis points from 47.5 basis points Friday.The three-month LIBOR rate peaked during the crisis at 4.81875% on Oct 10, 2008. This is rising again, but still low.
• The TED spread is at 0.57, and has been rising recently. the TED spread is the difference between the three month T-bill and the LIBOR interest rate. The 5 year graph shows that recent increase in comparison to the U.S. financial crisis in 2008.
 Here is a screen shot of the TED spread from Bloomberg.
 Click on graph for larger image.
The peak was 4.63 on Oct 10th. A normal spread is around 0.5.
• The A2P2 spread as at 0.47. This spread has increased recently, but is far below the peak of the financial crisis of 5.86.
This is the spread between high and low quality 30 day nonfinancial commercial paper. Right now high quality 30 day nonfinancial paper is yielding close to zero.
•
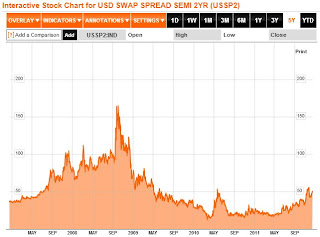
 The two year swap spread screen shot from Bloomberg. This spread is just under 50.
 This spread peaked at near 165 in early October 2008.
As the ECB noted today, there are signs of severe credit stress in Europe, but there hasn't been much spillover to the U.S. yet.


