 RSS Feed
 by Calculated Risk on 11/14/2011 09:47:00 AM
Monday, November 14, 2011
LPS: House Price Index Shows 3.8 Percent Year-Over-Year Decline in August
Another house price index ...
The LPS HPI is a repeat sales index that uses public disclosure by county recorders or loan origination data for purchase loans (if the sales price isn't disclosed).
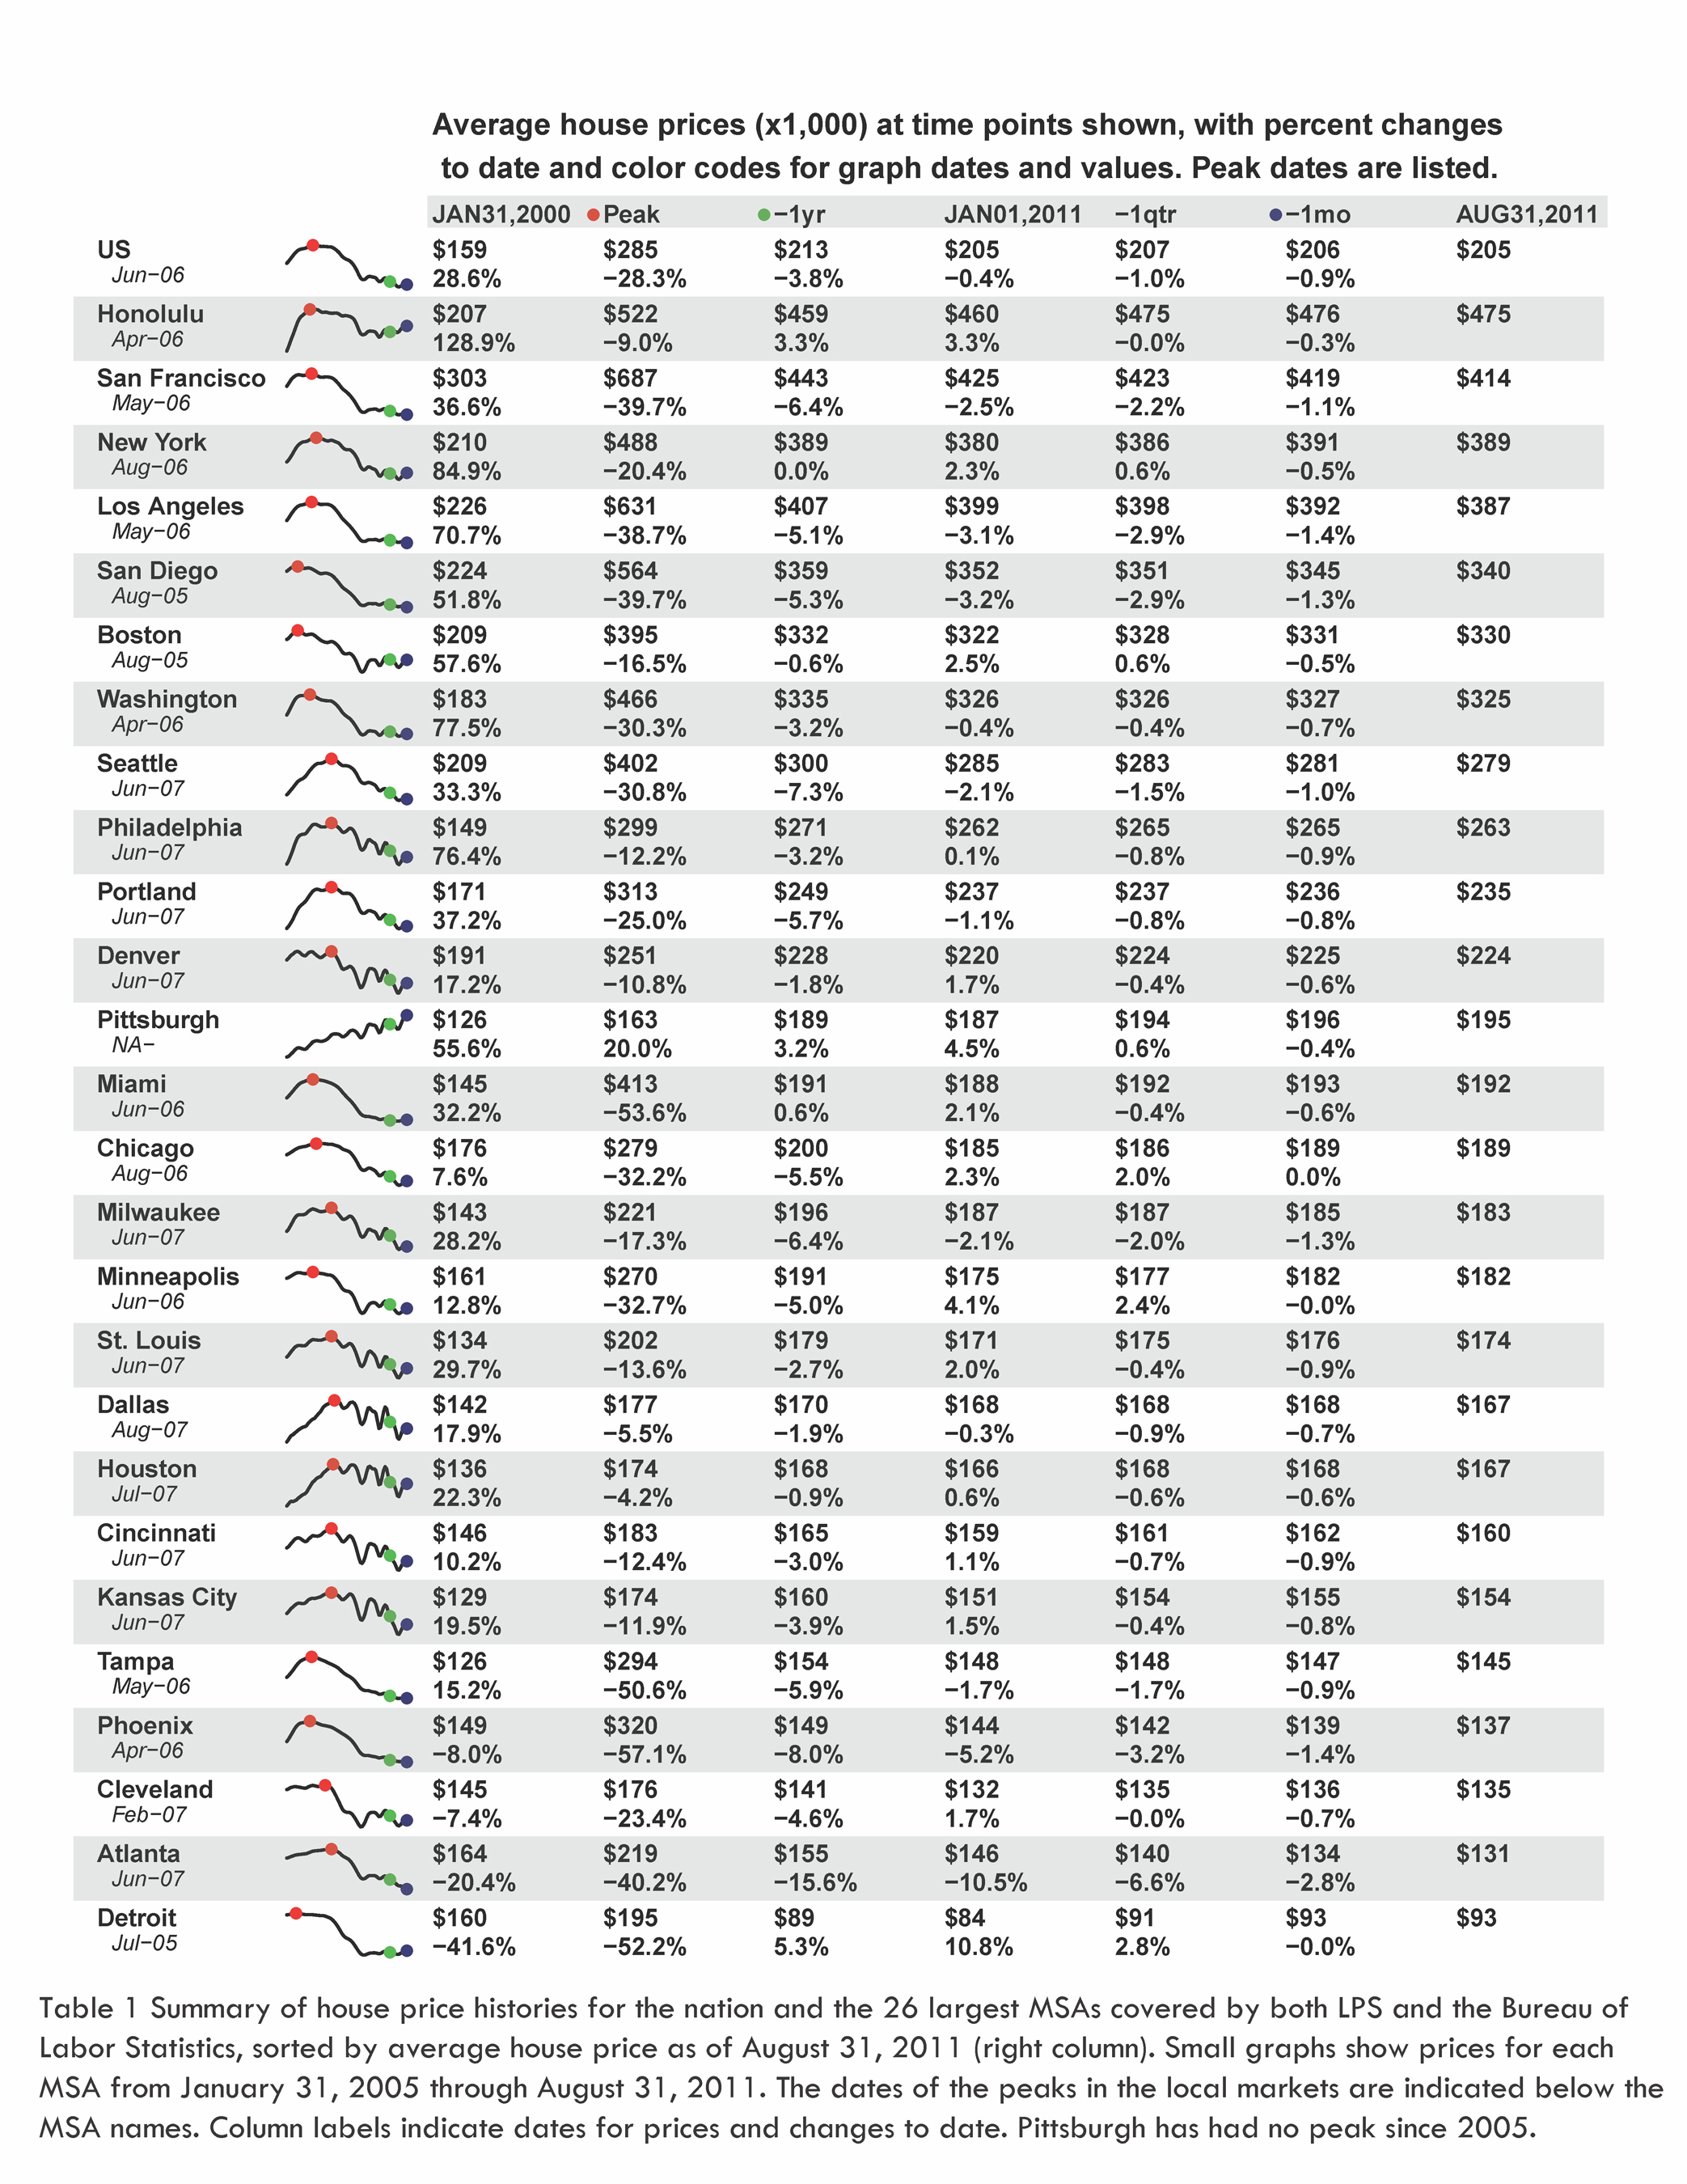
From LPS: Lender Processing Services’ Home Price Index Shows 3.8 Percent Year-Over-Year Decline in U.S. Home Prices in August; Nearly 30 Percent Off Market Peak
“In August sales transactions data, we saw the national average home price decline 0.9 percent, following a decline of 0.4 percent in July. This ended a series of increases during the spring of this year; a pattern that has occurred each year since 2009. In addition, the early, partial data for September sales indicates a likely further decline of approximately 1.1 percent to come. As of the end of August, the national average home price was $205,000. This is down 3.8 percent from August last year, and down 0.4 percent from January 1, 2011.”
 Click on graph for larger image.
 Home prices in August continued the downward trend begun after the market peak in June 2006. The LPS HPI average national home price has declined 28.3 percent since then. The total value of U.S. housing inventory covered by the LPS HPI stood at $10.6 trillion at the peak. As of the end of August 2011, it was $7.65 trillion. During the period of most rapid price changes, from July 31, 2007, through December, 2009, prices declined $56,000 from $282,000. The average annual decline during that time was 13.8 percent.In 2005 - at the peak of the bubble - most reporting focused on NAR median house prices. However median prices can be distorted by the mix of homes sold. The most followed repeat sales price index in 2005 was the OFHEO HPI (now FHFA), but that index was only for the GSEs - and missed the worst loans. The Case-Shiller index didn't become widely followed until 2007, and now we have a number of house price indexes!
Since December 2009, prices have fallen more slowly, interrupted by brief seasonal intervals of rising prices. Since then, the LPS HPI national average home price has fallen $20,000 from $225,000. This corresponds to an average annual decline of 3.6 percent.
...
Average prices declined during August in all but three of the 26 largest MSAs in the country that both the LPS HPI and Bureau of Labor Statistics’ economic data cover: Chicago, Detroit and Minneapolis remained essentially unchanged. Changes ranged from -0.3 percent in Honolulu to -2.8 percent in Atlanta (Table 1).
It appears all of the indexes will show new post-bubble lows later this year - or early in 2012.


