by Calculated Risk on 5/09/2011 10:00:00 AM
Monday, May 09, 2011
NY Fed Q1 Report on Household Debt and Credit
From the NY Fed: New York Fed's Quarterly Report on Household Debt and Credit Shows Signs of Healing in Consumer Credit Markets Since Last Quarter
The Federal Reserve Bank of New York released the Quarterly Household Debt and Credit Report for the first quarter of 2011 today, which showed signs of healing in the consumer credit markets. Evidence of improvement includes:Here is the Q1 report: Quarterly Report on Household Debt and Credit. Here are a couple of graphs:
• an increase in credit limits, by about $30 billion or 1%, for the first time since the third quarter of 2008;
• a steady number of open mortgage accounts, following a period of decline beginning in early 2008;
• continued decline of new foreclosures and new bankruptcies, down 17.7% and 13.3% respectively in the last quarter;
• a 15% decline of total delinquent balances, compared to a year ago; and
• a broad flattening of overall consumer debt balances outstanding.
Non-housing related debt, including credit cards, student loans, and auto loans, declined slightly (less than 1%), driven by a noticeable 4.6% decline in credit card balances. Credit inquiries, an indicator of consumer demand for new credit, came off their recent peak in the fourth quarter of 2010.
“We are beginning to see signs of credit markets healing gradually and evidence of greater willingness of consumers to borrow and banks to lend,” said Andrew Haughwout, vice president and New York Fed research economist.
 Click on graph for larger image in new window.
The first graph shows aggregate consumer debt increased slightly in Q1. From the NY Fed:
Aggregate consumer debt held essentially steady in the first quarter, ending a string of nine consecutive declining quarters. As of March 31, 2011, total consumer indebtedness was $11.5 trillion, a reduction of $1.03 trillion (8.2%) from its peak level at the close of 2008Q3, and $33 billion (0.3%) above its December 31, 2010 level.
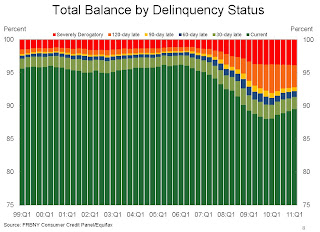
 The second graph shows the percent of debt in delinquency. What stands out is that the percent of delinquent debt is declining, but the percent of severely derogatory debt is remaining the same.
From the NY Fed:
Total household delinquency rates declined for the fifth consecutive quarter in 2011Q1. As of March 31, 10.5% of outstanding debt was in some stage of delinquency, compared to 10.8% on December 31, 2010 and 11.9% a year ago. About $1.2 trillion of consumer debt remains delinquent and $890 billion is seriously delinquent (at least 90 days late or “severely derogatory”). Compared to a year ago, both delinquent and seriously delinquent balances have fallen 15%.There are a number of credit graphs at the NY Fed site.


