by Calculated Risk on 5/19/2011 07:38:00 PM
Thursday, May 19, 2011
Mortgage Delinquencies by State: Percent and Number
Here are two more graphs based on the MBA Q1 National Delinquency Survey released this morning.
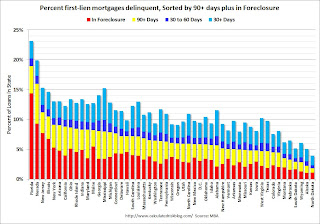
Earlier the MBA released a graph of the percent of loans "in foreclosure" by state. The following graph is similar, but includes all delinquent loans (sorted by percent seriously delinquent).
 Click on graph for larger image in graph gallery.
Florida and Nevada have the highest percentage of serious delinquent loans, followed by New Jersey, Illinois, New York, Arizona and California.
Comment: It has always bothered me that several southern states always have an elevated percentage of mortgage loans 30+ day delinquent (Mississippi, Alabama, Texas, Georgia, and Louisiana all have a large percentage light blue). Most of these borrowers always seem to catch up - they just make their payments late. That means the lenders generate plenty of late fees in these states. This might be something for the Consumer Financial Protection Bureau to investigate.
 The second graph shows the number of loans delinquent in each state (as opposed to the percent). California is the largest state, so it is no surprise that the number of delinquent loans is very high (I'd expect California to always be #1). In that sense this graph is misleading - in reality California is in about the same shape as New York, Arizona, Ohio and Rhode Island (first graph).
There are plenty of problems in California, but nothing like Florida. Florida has 57% the number of mortgages as California, but more delinquent loans. In most ways, dividing this by states is arbitrary - except the foreclosure process matters. States with only judicial foreclosures tend to have many more loans in the foreclosure process (just because it takes longer).
Earlier:
• April Existing Home Sales: 5.05 million SAAR, 9.2 months of supply
• MBA: Total Delinquencies essentially unchanged in Q1 Seasonally Adjusted
• Philly Fed Survey shows "regional manufacturing activity grew slightly in May"
• Weekly Initial Unemployment Claims declines to 409,000, 4-Week average highest since November
• Existing Home Sales graphs


