by Calculated Risk on 3/26/2011 11:31:00 AM
Saturday, March 26, 2011
Summary for Week ending March 25th
World events once again dominated the headlines last week, with the Japanese nuclear issues, Libya, the Middle-East (especially Syria) and also the European financial crisis (Portugal, Ireland, Greece - even Spain and more) all on the front page.
In the U.S., the economic data was weaker, mostly because the major economic releases were housing related. New home sales were at a record low, and existing home sales fell sharply. But also durable goods orders were weaker than expected and consumer sentiment declined sharply from February (probably due to high gasoline prices and world events).
On the positive side, initial weekly unemployment claims continued to decline and the Richmond Fed manufacturing survey indicated continued expansion in March.
Below is a summary of economic data last week mostly in graphs:
• New Home Sales Fall to Record Low in February
 Click on graph for larger image in graph gallery.
The Census Bureau reported New Home Sales in February were at a seasonally adjusted annual rate (SAAR) of 250 thousand. This was down from a revised 301 thousand in January.
The first graph shows New Home Sales vs. recessions since 1963. The dashed line is the current sales rate. This was a new record low sales rate and well below the consensus forecast of 290 thousand homes sold (SAAR).
 The 2nd graph shows "months of supply". Months of supply increased to 8.9 in February from 7.4 months in January. The all time record was 12.1 months of supply in January 2009. This is very high (less than 6 months supply is normal).
The third graph shows sales NSA (monthly sales, not seasonally adjusted annual rate).
 In February 2010 (red column), 19 thousand new homes were sold (NSA). This is a new record low for the month of February.
The previous record low for February was 27 thousand in 2010. The high was 109 thousand in 2005.
This was a very weak report ...
• February Existing Home Sales: 4.88 million SAAR, 8.6 months of supply
The NAR reported: February Existing-Home Sales Decline
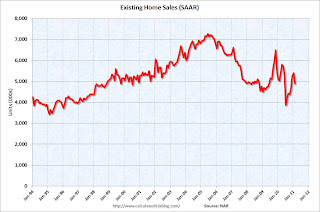
 This graph shows existing home sales, on a Seasonally Adjusted Annual Rate (SAAR) basis since 1993.
Sales in February 2011 (4.88 million SAAR) were 9.6% lower than last month, and were 2.8% lower than February 2010.
The next graph shows the year-over-year (YoY) change in reported existing home inventory and months-of-supply. Inventory is not seasonally adjusted, so it really helps to look at the YoY change.
 Although inventory increased from January to February (as usual), inventory decreased 1.2% YoY in February. This is a small YoY decrease and follows six consecutive month of year-over-year increases in inventory.
Inventory should increase over the next few months (the normal seasonal pattern), and the YoY change is something to watch closely this year. Inventory and "months of supply" are already very high, and further YoY increases in inventory would put more downward pressure on house prices.
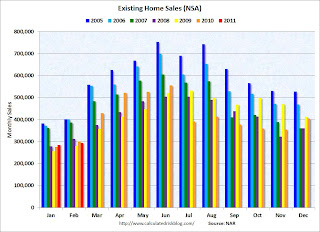
 This graph shows existing home sales Not Seasonally Adjusted (NSA).
The red columns in January and February are for 2011.
Sales NSA were about the same level as the last three years. February is usually the second weakest month of the year for existing home sales (close to January). The real key is what happens in the spring and summer - and March sales and inventory will give a clearer picture of existing home sales activity.
• AIA: Architecture Billings Index increased slightly in February
From the American Institute of Architects: Architecture Firm Billings Increase Slightly in February. Note: This index is a leading indicator for new Commercial Real Estate (CRE) investment.
 This graph shows the Architecture Billings Index since 1996. The index showed billings were slightly higher in February (at 50.6).
According to the AIA, there is an "approximate nine to twelve month lag time between architecture billings and construction spending" on non-residential construction. So this indicator suggests the drag from CRE investment will end mid-year 2011 or so - but there won't be a strong increase in investment.
• Consumer Sentiment declines in March
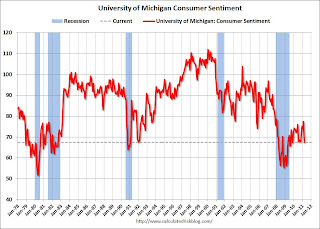
 The final March Reuters / University of Michigan consumer sentiment index declined to 67.5 from the preliminary March reading of 68.2 - and down from 77.5 in February. This is the lowest level since November 2009 and was below the consensus forecast of 68.0.
In general consumer sentiment is a coincident indicator and is usually impacted by employment (and the unemployment rate) and gasoline prices.
With higher gasoline prices and the scary world news, a low reading isn't that surprising.
• Other Economic Stories ...
• From the Chicago Fed: Economic Growth Near Average in February
• From the Richmond Fed: Manufacturing Activity Continues to Advance in March; Expectations Remain Upbeat
• ATA Truck Tonnage Index declined in February
• Moody's: Commercial Real Estate Prices declined 1.2% in January
• DOT: Vehicle Miles Driven increased slightly in January
• Q4 Real GDP Growth revised up to 3.1%
• Unofficial Problem Bank list increases to 985 Institutions
Best wishes to all!


