by Calculated Risk on 2/18/2011 10:24:00 AM
Friday, February 18, 2011
LA Port Traffic in January
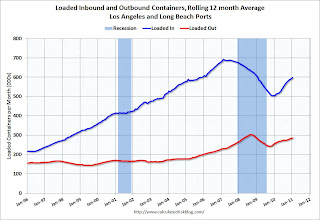
The first graph shows the rolling 12 month average of loaded inbound and outbound traffic at the ports of Los Angeles and Long Beach in TEUs (TEUs: 20-foot equivalent units or 20-foot-long cargo container). Although containers tell us nothing about value, container traffic does give us an idea of the volume of goods being exported and imported - and possible hints about the trade report for January. LA area ports handle about 40% of the nation's container port traffic.
 Click on graph for larger image in graph gallery.
To remove the strong seasonal component for inbound traffic, this graph shows the rolling 12 month average.
On a rolling 12 month basis, inbound traffic is up 18% and outbound up 11%.
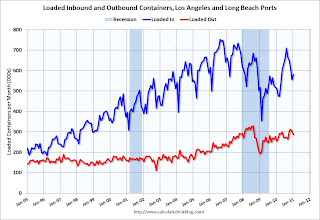
 The 2nd graph is the monthly data (with strong seasonal pattern).
For the month of January, loaded inbound traffic was up 13% compared to January 2010, and loaded outbound traffic was up 12% compared to January 2010 - but down compared to December 2010. This suggests the trade deficit with China (and other Asians countries) probably increased in January.


