by Calculated Risk on 2/17/2011 03:14:00 PM
Thursday, February 17, 2011
Hotel Occupancy Rate: Hotels Struggling in 2011
This year has been tough for hotel occupancy, with only a small increase over the very low levels for the same period a year ago. Here is the weekly update on hotels from HotelNewsNow.com: Midscale segment reports weekly decreases
Overall, the U.S. hotel industry’s occupancy increased 1.7% to 54.7%, ADR was up 0.7% to US$97.88, and RevPAR finished the week up 2.4% to US$53.51.The following graph shows the four week moving average of the occupancy rate as a percent of the median occupancy rate from 2000 through 2007.
 Click on graph for larger image in graph gallery.
Note: Since this is the percent of the median from 2000 to 2007, the percent can be greater than 100%.
The down spike in 2001 was due to 9/11. The up spike in late 2005 was hurricane related (Katrina and Rita). The dashed line is the current level.
This shows how deep the slump was in 2009 compared to the period following the 2001 recession. This also shows the occupancy rate improvement has slowed sharply since the beginning of the year (about 90% of the median from 2000 to 2007).
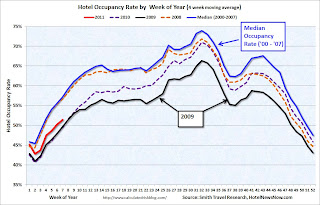
 And here is the "spider" graph showing the seasonal pattern for the hotel occupancy rate.
The occupancy rate really fell off a cliff in the 2nd half of 2008, and then 2009 was the worst year for the occupancy rate since the Great Depression. The occupancy rate started to improve in the Spring of 2010, and was above the 2008 rates later in the year.
However, so far, 2011 is closer to the weak occupancy rates of 2009 and early 2010 than to the median for 2000 through 2007.
Blame it on the snow ... but if the occupancy rate doesn't pick up soon, Smith Travel will be reporting year-over-year declines in the occupancy rate again.
Data Source: Smith Travel Research, Courtesy of HotelNewsNow.com


