by Calculated Risk on 1/09/2011 09:08:00 AM
Sunday, January 09, 2011
Summary for Week ending January 8th
Note: here is the economic Schedule for Week of January 9th.
Below is a summary of the previous week, mostly in graphs.
• December Employment Report: 103,000 Jobs, 9.4% Unemployment Rate
The BLS reported that payroll employment increased by 103,000 in December, and the unemployment rate declined to 9.4 percent.
 Click on graph for larger image.
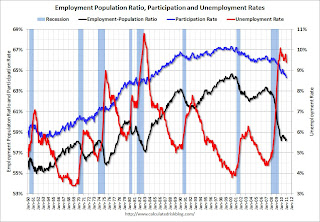
This graph shows the employment population ratio, the participation rate, and the unemployment rate. The unemployment rate decreased to 9.4% (red line).
The Labor Force Participation Rate declined to 64.3% in December (blue line). The Employment-Population ratio increased to 58.3% in December (black line).
 The second graph shows the job losses from the start of the employment recession, in percentage terms aligned at maximum job losses. The dotted line is ex-Census hiring.
The best news was the decline in the unemployment rate to 9.4% from 9.8% in November. However this was partially because the participation rate declined to 64.3% - a new cycle low, and the lowest level since the early '80s. Note: This is the percentage of the working age population in the labor force.
The 103,000 payroll jobs added was below expectations of 140,000 jobs, however payroll for October payroll was revised up 38,000 and November was revised up 32,000 for a total of 70,000.
The increase in the long term unemployed, and the high level of part time workers for economic reasons are ongoing concerns. The average workweek was steady at 34.3 hours, and average hourly earnings ticked up 3 cents.
• U.S. Light Vehicle Sales at 12.55 million SAAR in December
 Based on an estimate from Autodata Corp, light vehicle sales were at a 12.55 million SAAR in December. That is up 13.1% from December 2009, and up 2.7% from the November 2010 sales rate.
This graph shows light vehicle sales since the BEA started keeping data in 1967.
Note: dashed line is current estimated sales rate. The current sales rate is still near the bottom of the '90/'91 recession - when there were fewer registered drivers and a smaller population.
This was above most forecasts of around 12.3 million SAAR.
• ISM Manufacturing Index increases in December
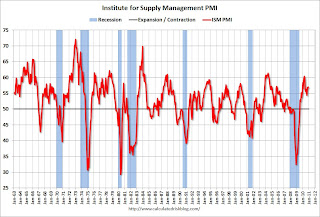
 The Institute for Supply Management reported the PMI was at 57.0% in December, up slightly from 56.6% in November.
Here is a long term graph of the ISM manufacturing index.
This was slightly below expectations and in line with the regional Fed manufacturing surveys.
• ISM Non-Manufacturing Index showed expansion in December
 The December ISM Non-manufacturing index was at 57.1%, up from 55.0% in November - and above expectations of 55.5%. The employment index showed slower expansion in December at 50.5%, down from 52.7% in November. Note: Above 50 indicates expansion, below 50 contraction.
This graph shows the ISM non-manufacturing index (started in January 2008) and the ISM non-manufacturing employment diffusion index.
• Private Construction Spending increased in November
 The Census Bureau reported overall construction spending increased in November compared to October. "[C]onstruction spending during November 2010 was estimated at a seasonally adjusted annual rate of $810.2 billion, 0.4 percent (±1.6%)* above the revised October estimate of $806.7 billion."
Private construction spending also increased in November: "Spending on private construction was at a seasonally adjusted annual rate of $491.8 billion, 0.3 percent (±1.1%)* above the revised October estimate of $490.5 billion."
This graph shows private residential and nonresidential construction spending since 1993. Private residential spending increased in November; private non-residential construction spending is still declining.
Sometime this year (in 2011), residential construction spending will probably pass non-residential spending. Although I expect the recovery in residential spending to be sluggish, Residential investment will probably make a positive contribution to GDP growth in 2011 for the first time since 2005.
• Other Economic Stories ...
• From Bloomberg: Banks Lose Pivotal Massachusetts Foreclosure Case
• From Alejandro Lazo at the LA Times: Housing bust creates new kind of declining city
• Reis: Apartment Vacancy Rates decline in Q4
• Reis: Strip Mall Vacancy rates steady in Q4
• Reis: Office Vacancy Rate steady in Q4
• From the American Bankruptcy Institute: Consumer Bankruptcy Filings increase 9 percent in 2010
• ADP: Private Employment increased by 297,000 in December
• Restaurant Performance Index slips in November
• Unofficial Problem Bank list increases at 932 Institutions
Best wishes to all!


