by Calculated Risk on 1/07/2011 02:12:00 PM
Friday, January 07, 2011
Employment: The Declining Participation Rate
An interesting question is why the unemployment rate fell so sharply, even with relatively few payroll jobs added (103,000 jobs added in December).
First, it is important to remember that there are two separate surveys for the Employment Situation Summary. The unemployment rate comes from the Current Population Survey (CPS: commonly called the household survey), a monthly survey of about 60,000 households.
The payroll jobs number comes from Current Employment Statistics (CES: payroll survey), a sample of "approximately 140,000 businesses and government agencies representing approximately 410,000 worksites". See this post for a discussion of the two surveys.
The following table is based on the Household survey (all seasonally adjusted):
| Household Survey (000s) | November | December | Change |
|---|---|---|---|
| Civilian noninstitutional population (16 and over) | 238,715 | 238,889 | 174 |
| Civilian labor force | 153,950 | 153,690 | -260 |
| Employed | 138,909 | 139,206 | 297 |
| Unemployed | 15,041 | 14,485 | -556 |
| Participation Rate | 64.49% | 64.34% | -0.16% |
| Unemployment Rate | 9.77% | 9.42% | -0.35% |
The household survey measures percentages for the 60,000 households (unemployment rate, participation rate) and then the BLS derives the other numbers based on the population estimate.
So the estimated number of unemployed dropped by 556,000. Some of this decline was due to higher employment, but some was also due to the decline in participation - even while the population increased.
The table helps explain why the reported unemployment rate fell from 9.8% to 9.4%. A key reason was the decline in the participation rate. If the participation rate had held steady at 64.5%, then the unemployment rate would have only declined to 9.64%.
So almost 2/3rds of the decline in the unemployment rate was related to the decline in the participation rate. Some of the decline might be from workers going back to school, but some is probably due to people just giving up.
A large portion of the decline in the participation rate was for people in the 16 to 24 age group. According to the BLS, the 16 to 24 civilian labor force declined by 244 thousand. Most of these people will probably return to the labor force as the economy improves - and that will put upward pressure on the unemployment rate.
Another group that saw a decline in the participation rate was men in the key 25 to 54 age group. I wonder if these people are just giving up?
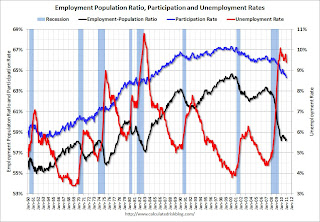
 Click on graph for larger image.
Here is a repeat of the graph showing the unemployment rate (red), the participation rate (blue), and the employment-population ratio (black).
The participation rate has fallen sharply from 66% at the start of the recession to 64.3% in December. That is almost 4 million workers who are no longer in the labor force and not counted as unemployed in U-3, although most are included as "discouraged workers" or "Marginally Attached to Labor Force" in U-6.
A decline in the unemployment rate mostly due to a decline in the participation rate is not good employment news.
Earlier Employment posts:
• Employment Summary and Part Time Workers, Unemployed over 26 Weeks
• December Employment Report: 103,000 Jobs, 9.4% Unemployment Rate


