by Calculated Risk on 11/13/2010 09:59:00 PM
Saturday, November 13, 2010
Labor Force Participation Trends, Over 55 Age Groups
On Thursday I asked: What will happen to the Labor Force Participation Rate?
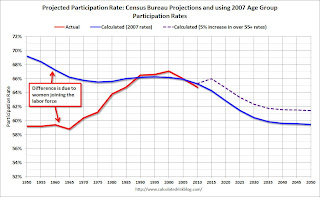
I posted a series of graphs trying to show the trends in participation - and one of the graphs I posted showed two projections for the labor force participation rate through 2050 (using population projections from the Census Bureau). Here is that graph again:
 Click on graph for larger image.
This graph shows the calculated participation rate (blue) through 2050, and the actual participation rate since 1950 (red). The calculated participation rate, using 2007 data, is far too high for the earlier periods. This is mostly because of women joining the labor force (see the previous post for more on women joining the labor force).
The blue line would indicate the participation rate over the next 40 years if the participation rate per age group stayed static at 2007 levels. The participation rate would be expected to decline as the population ages. This simple analysis suggests the participation rate would be at about the same level in 2015 as today.
I added the dashed purple line to show the impact of a 5 percentage point increase in the 'over 55' labor force participation rate. I pointed out that the participation rate for the 'over 55' age group has been trending up. If the trend continues for the 'over 55' group - perhaps because of necessity, perhaps because of fewer "back breaking" jobs - then the overall participation rate will not fall as quickly as the blue line indicates. With just a 5 percentage point increase in participation for the 'over 55', the participation rate will be back to 66% in 2015.
A couple of readers asked if this was possible? The answer is yes.
 The second graph shows the participation rate for several over 55 age groups. The red line is the '55 and over' total seasonally adjusted. All of the other age groups are Not Seasonally Adjusted (NSA).
The participation rate is trending up for all age groups. And another five percentage point increase is very possible over the next 5 to 10 years. After that the 'over 55' participation rate might start to decline as the oldest baby boomers move into the 'over 75' age group.
All of this suggests to me that the participation rate will probably move back towards 66% over the next few years, even with an aging population.


