 RSS Feed
 by Calculated Risk on 10/27/2010 12:24:00 PM
Wednesday, October 27, 2010
Home Sales: Distressing Gap Sept 2010
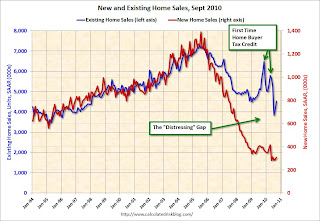
By request, here is an update - this graph shows existing home sales (left axis) and new home sales (right axis) through September. This graph starts in 1994, but the relationship has been fairly steady back to the '60s. Then along came the housing bubble and bust, and the "distressing gap" appeared (due partially to distressed sales).
Note: it is important to note that existing home sales are counted when transactions are closed, and new home sales are counted when contracts are signed. So the timing of sales is different.
 Click on graph for larger image in new window.
Initially the gap was caused by the flood of distressed sales. This kept existing home sales elevated, and depressed new home sales since builders couldn't compete with the low prices of all the foreclosed properties.
The two spikes in existing home sales were due primarily to the homebuyer tax credits (the initial credit last year, followed by the 2nd credit this year). There were also two smaller bumps for new home sales related to the tax credits.
Now, once again, the gap is mostly because of the continuing flood of distressed sales (both foreclosures and short sales). I expect that eventually this gap will be closed, however that will only happen after the huge overhang of existing inventory (especially distressed inventory) is significantly reduced.


