 RSS Feed
 by Calculated Risk on 10/21/2010 11:35:00 AM
Thursday, October 21, 2010
FHFA Projections for Fannie and Freddie draws, and House Price Assumptions
From the FHFA: FHFA Releases Projections Showing Range of Potential Draws for Fannie Mae and Freddie Mac
To date, the Enterprises have drawn $148 billion from the Treasury Department under the terms of the [Preferred Stock Purchase Agreements] PSPAs. Under the three scenarios used in the projections, cumulative Enterprise draws range from $221 billion to $363 billion through 2013.The key to the size of future draws is the trajectory of house prices. The following graph shows the three house projections used by the FHFA:
 Click on graph for larger image in new window.
From the FHFA:
Stronger Near-term Recovery (FHFA Scenario 1) “Increased access to credit supports the above baseline growth. As a result, the recent increases in house prices are sustained, although additional increases are minimal in 2010 and 2011.” The peak to-trough decline is 31%. From the trough in 1Q09 to the end of the forecast period house prices increase by 5%.My current projection is for further house price declines of 5% to 10%, as measured by the Case-Shiller and Corelogic repeat sales indexes. That would put the peak-to-trough decline around 36% or so. So my guess is somewhere between scenarios 2 & 3.
Current Baseline (FHFA Scenario 2) "Small remaining home price declines" contribute to a 34% peak-to-trough decline. From the trough in 3Q11 to the end of the forecast period house prices increase by 8%.
Deeper Second Recession (FHFA Scenario 3) “As a result of restricted access to credit and continuing high unemployment, the moderate
rebound in housing construction that occurred over the first half of 2009 not only pauses but reverses course." The peak-to-trough decline is 45%. From the trough in 1Q12 to the end of the forecast period house prices increase by 11%.
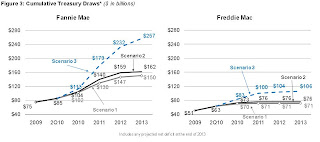 And this graph shows the projected draws for each of the above scenarios.
My guess is the draw will be somewhat over scenario 2, but well below the FHFA's scenario 3.


