 RSS Feed
 by Calculated Risk on 9/22/2010 05:18:00 PM
Wednesday, September 22, 2010
HAMP data for August
From Treasury: HAMP Servicer Performance Report Through August 2010
And here is the HUD Housing Scorecard.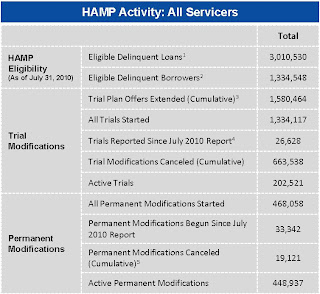 Click on table for larger image in new window.
About 468 thousand modifications are now "permanent" - up from 422 thousand last month - and 663 thousand trial modifications have been cancelled.
The pace of new trial modifications has slowed sharply from over 150,000 in September 2009 to under 18,000 in August. The program has slowed way down. The second graph shows the aged trials (greater than 6 months) as a percent of total trials.
According to HAMP, there are 202,521 "active trials", down from 255,934 last month.
The shows that the HAMP servicers have made progress on getting borrowers out of "modification limbo" - although the trial program was originally designed to be for 3 months - so maybe the measurement should be 4 months (instead of 6 months).
Debt-to-income ratios
If we look at the HAMP program stats (see page 3), the median front end DTI (debt to income) before modification was 44.9% - the same as last month. And the back end DTI1 was an astounding 79.9%.
This means that for the median borrower, about 80% of the borrower's income went to servicing debt. And the median is 63.5% after the modification.
These borrowers still have too much debt, even after the modification - and that suggests an eventual high redefault rate. There have been 18,773 redefaults already. It would be nice to see percent defaults by months from when the "permanent modification" started.
1 Back end DTI from HAMP:
Ratio of total monthly debt payments (including mortgage principal and interest, taxes, insurance, homeowners association and/or condo fees, plus payments on installment debts, junior liens, alimony, car lease payments and investment property payments) to monthly gross income.


