 RSS Feed
 by Calculated Risk on 9/23/2010 11:28:00 AM
Thursday, September 23, 2010
Existing Home Inventory increases 1.5% Year-over-Year
Earlier the NAR released the existing home sales data for August; here are a couple more graphs ...
The first graph shows the year-over-year (YoY) change in reported existing home inventory and months-of-supply. Inventory is not seasonally adjusted, so it really helps to look at the YoY change.  Click on graph for larger image in new window.
Although inventory decreased slightly from July 2010 to August 2010, inventory increased 1.5% YoY in August.
Note: Usually July is the peak month for inventory.
The year-over-year increase in inventory is especially bad news because the reported inventory is already historically very high (around 4 million), and the 11.6 months of supply in August is far above normal.
Based on the MBA mortgage purchase applications index, it appears there will be little increase in sales over the next couple of months (sales will probably remain in the low-to-mid 4 million SAAR range). That means we will see double digit months-of-supply for some time - and that suggests house prices will continue to fall.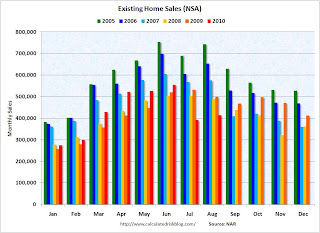 By request - the second graph shows existing home sales Not Seasonally Adjusted (NSA).
The red columns are for 2010. Sales for the last two months are significantly below the previous years, and sales will probably be well below the previous years for the remainder of 2010.
The bottom line: Sales were very weak in August - almost exactly at the levels I expected - and will continue to be weak for some time. Inventory is very high, and that will put downward pressure on house prices.


