 RSS Feed
 by Calculated Risk on 8/26/2010 10:10:00 PM
Thursday, August 26, 2010
Summary, Fannie-Freddie "Autopsy", and European Bond Spreads
Here’s a last-minute option for summer reading material: An autopsy on Fannie Mae and Freddie Mac by their overseer, the Federal Housing Finance Agency.
The report aims to inform the continuing debate in Washington about the future of the government’s role in housing finance. It’s not hard sledding, just 15 pages of bullet points and charts. And it does a good job of making a few key points:
1. Fannie and Freddie did not cause the housing bubble. ...
2. This was not for a lack of trying. ...
3. Importantly, the companies’ losses are mostly in their core business of guaranteeing loans, not in their investment portfolios.
 Click on graph for larger image in new window.
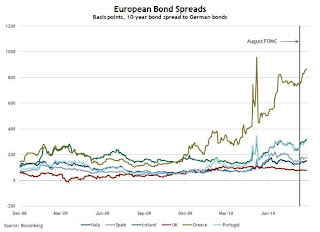
From the Atlanta Fed:
Peripheral European bond spreads (over German bonds) have risen since the August FOMC meeting.In fact the Greece-to-Germany, and the Ireland-to-Germany, bond spreads are near the levels reached during the May financial crisis.
 The total percent of loans delinquent or in the foreclosure process declined only slightly in Q2 from Q1 - and the rate is the second highest on record.
Loans 30 days delinquent increased to 3.51%, and this is about the same levels as in Q4 2008 (slightly below the peak of 3.77% in Q1 2009).
Delinquent loans decreased in all other buckets - especially in the 90+ day bucket. MBA Chief Economist Jay Brinkmann suggested the decline in the 90+ day bucket was because of some successful modifications - since the lenders reported the loans as delinquent until the modification was made permanent.
 This graph shows the negative equity and near negative equity by state.
 Although the five states mentioned above have the largest percentage of homeowners underwater, 10 percent or more of homeowners with mortgages in 33 states and the D.C. have negative equity.


