 RSS Feed
 by Calculated Risk on 8/09/2010 04:15:00 PM
Monday, August 09, 2010
Rail Traffic increases 4.1% in July compared to July 2009
From the Association of American Railroads: Rail Time Indicators. The AAR reports traffic in July 2010 was up 4.1% compared to July 2009 - and traffic was 14.6% lower than in July 2008.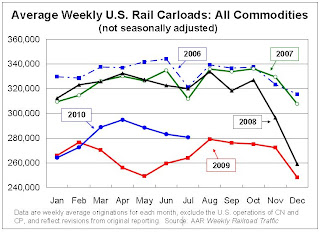 Click on graph for larger image in new window.
This graph shows U.S. average weekly rail carloads (NSA). Traffic increased in 14 of 19 major commodity categories year-over-year.
From AAR:
• U.S. freight railroads originated 1,122,308 carloads in July 2010, an average of 280,577 carloads per week — up 4.1% from July 2009 (see chart) but down 14.6% from July 2008 on a non-seasonally adjusted basis.As the graph above shows, rail traffic collapsed in November 2008, and now, a year into the recovery, traffic has only recovered part way.
• On a seasonally adjusted basis, U.S. rail carloads rose 3.2% in July 2010 from June 2010 after falling 1.2% in June 2010 and 0.9% in May 2010. The seasonally adjusted weekly average of 289,320 carloads in July 2010 was the highest such figure since November 2008.
excerpts with permission
Seasonally there is usually a decline in traffic in July, so seasonally adjusted traffic increased last month. However traffic is only up 4.1% compared to July 2009.


