 RSS Feed
 by Calculated Risk on 6/30/2010 04:06:00 PM
Wednesday, June 30, 2010
Market Update
The end of Q2 ...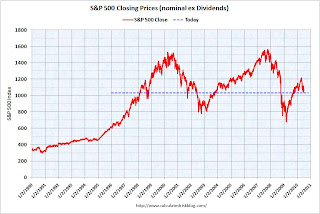 Click on graph for larger image in new window.
The first graph shows the S&P 500 since 1990 (this excludes dividends).
The dashed line is the closing price today. The S&P 500 was first at this level in February 1998; over 12 years ago. 
Click on graph for interactive version in new window.
The graph has tabs to look at the different bear markets - "now" shows the current market - and there is also a tab for the "four bears".


