 RSS Feed
 by Calculated Risk on 6/17/2010 03:03:00 PM
Thursday, June 17, 2010
Hotel Occupancy Increases
From HotelNewsNow.com: STR: Luxury segment leads weekly increases
Overall, the industry’s occupancy increased 8.2 percent to 65.8 percent, ADR was up 1.7 percent to US$98.55, and RevPAR rose 10.0 percent to US$64.83.Note: As I noted last week, Memorial Day was late this year. That made last week look worse than actual, and made this week look better. This is why I use the 4-week moving average.
The following graph shows the four week moving average for the occupancy rate by week for 2008, 2009 and 2010 (and a median for 2000 through 2007).
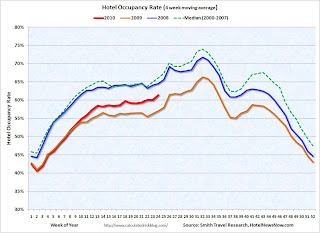 Click on graph for larger image in new window.
Notes: the scale doesn't start at zero to better show the change.
On a 4-week basis, occupancy is up 7.6% compared to last year (the worst year since the Great Depression) and still about 7% below normal.
Note: The graph shows the distinct seasonal pattern for the occupancy rate - higher in the summer because of leisure/vacation travel.
Last year leisure travel (summer) held up better than business travel, now it appears business travel is recovering - and we will soon see if leisure travel will also pick up this year.
Data Source: Smith Travel Research, Courtesy of HotelNewsNow.com


