 RSS Feed
 by Calculated Risk on 6/15/2010 03:47:00 PM
Tuesday, June 15, 2010
Employment and Real GDP, Real GDI
Last night I excerpted from a speech by St Louis Fed President James Bullard. I noted that GDI might be more useful in measuring the recovery than GDP (they are conceptually equivalent).
As a followup to that post (and also to the previous post with the forecast from UCLA-Anderson's Ed Learmer), here are two graphs looking at payroll employment vs. the change in real GDP and real GDI.
At the bottom of this post are estimates of the unemployment rate in 12 months for several growth scenarios. Note: This is similar to Okun's relationship between GDP and unemployment.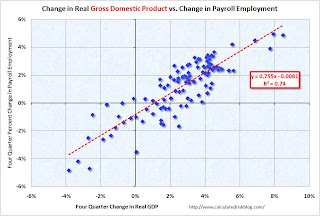 Click on graph for larger image.
The first graph shows the four quarter change in real GDP vs. the four quarter change in employment, as a percent of payroll employment (to normalize for changes in payroll over time).
The second graph shows the same relationship, but uses Gross Domestic Income instead of GDP. There is a clear relationship - the higher the change in the real GDP or real GDI, the larger the increase in payroll employment. The R2 for GDI is slightly higher than for GDP (0.80 vs. 0.74).
This shows that real GDP / real GDI has to grow at a sustained rate of about 1% just to keep the net change in payroll jobs at zero.
A 3% increase in real GDI (over a year) would lead to about a 1.4% increase in payroll employment. With approximately 130 million payroll jobs, a 1.4% increase in payroll employment would be just over 1.8 million jobs over the next year - and the unemployment rate would probably remain close to the current level (9.7%) depending on changes in population and the participation rate.
The following table summarizes several growth scenarios. The unemployment rate is from the household survey and depends on the number of people in the work force - so it cannot be calculated directly. The table uses a range of unemployment rates based on 1.6 to 2.1 million people entering the workforce over the next 12 months (a combination of population growth and discouraged workers reentering the work force).
NOTE: For those interested in understanding the differences between the household and establishment employment surveys - and why the unemployment rate cannot be calculated directly from the payroll report, see: Jobs and the Unemployment Rate
| Real Growth | Percent Payroll Growth | Annual Payroll Growth (000s) | Monthly Payroll Growth (000s) | Unemployment Rate in One Year1 |
|---|---|---|---|---|
| 6.0% | 3.6% | 4648 | 387 | 7.6% to 7.9% |
| 5.0% | 2.9% | 3718 | 310 | 8.2% to 8.5% |
| 4.0% | 2.1% | 2787 | 232 | 8.8% to 9.1% |
| 3.0% | 1.4% | 1857 | 155 | 9.4% to 9.7% |
| 2.0% | 0.7% | 926 | 77 | 10.0% to 10.3% |
| 1.0% | 0.0% | -4 | 0 | 10.6% to 10.9% |
| 1The unemployment rate is from the Household Survey and depends on several factors including changes in population and the participation rate. | ||||
I think Leamer is a little optimistic for 2010 - I'm expecting a 2nd half slowdown in GDP growth this year - and I think the unemployment rate will stay near the current level for some time.


