 RSS Feed
 by Calculated Risk on 5/02/2010 12:35:00 PM
Sunday, May 02, 2010
Weekly Summary and a Look Ahead
The key economic report for the week will be the April Employment Report to be released on Friday.
On Monday the Personal Income and Outlays report for March will be released at 8:30 AM ET. This will also include the underlying details for the Q1 GDP report. At 10 AM ET, the ISM Manufacturing index for April will be released (expectations are for an increase to 61 from 59.6 in March) and Construction Spending for March (consensus is for another decline in spending).
Also on Monday, the automakers will report vehicle sales for April. Expectations are for a slight increase from the 11.75 million SAAR for light vehicles in March. The American Bankruptcy Institute will probably report personal bankruptcy filings for April too. This will probably show another "surge" in filings.
On Tuesday, the Census Bureau will release factory orders for March, and the NAR will release March Pending Home Sales at 10 AM (expect a tax credit related increase).
On Wednesday, the ADP employment report will be released (consensus is for an increase of 28K private sector jobs). This will probably be the first increase in the ADP employment report since the recession started. Also on Wednesday, the ISM non-manufacturing report for April will be released. Consensus is for an increase in the service sector.
On Thursday, the closely watched initial weekly unemployment claims will be released. Consensus is for a decline to 440K from 448K last week. Also the Q1 Productivity and Costs report will be released at 8:30 AM.
Also on Thursday, Fed Chairman Ben Bernanke will speak at 9:30 AM at the Chicago Federal Reserve Bank 46th Annual Conference on Bank Structure. There are some interesting topics being covered at the conference, including a discussion of The Future of the Housing GSEs.
And on Friday, the BLS will release the April Employment report at 8:30 AM. The consensus is for a gain of 200K in payroll jobs in April (about 100K from temporary census hiring), and for the unemployment rate to decline slightly to 9.6%. It will be important to remove the Census hiring to try to determine the underlying trend.
Also on Friday the Federal Reserve will release consumer credit for March (expectations are for another decline in credit), and of course the FDIC will probably have another busy Friday afternoon ...
The NMHC Apartment Tightness index for Q1 might be released with week. This is a leading indicator for apartment rents.
And a summary of last week:
From the BEA: Gross Domestic Product: First Quarter 2010. A couple of graphs ...
The first graph shows the rolling 4 quarter contribution to GDP from residential investment, equipment and software, and nonresidential structures. Red is residential, green is equipment and software, and blue is investment in non-residential structures. The usual pattern - both into and out of recessions is - red, green, blue.
 Click on graph for larger image in new window.
The key leading sector - residential investment - is lagging the recovery because of the huge overhang of existing inventory. Usually RI is a strong contributor to GDP growth and employment in the early stages of a recovery, but not this time - and this is a key reason why the recovery has been sluggish so far.
 The second graph shows real personal income less transfer payments as a percent of the previous peak.
Unlike the recovery in GDP, real personal income less transfer payments has barely increased and is still 6.6% below the pre-recession level.
The peak of the stimulus spending is in Q2 2010 (right now), and then the stimulus spending starts to taper off in the 2nd half of 2010. So underlying demand better increase soon - and that means jobs and incomes going forward.
The Fed's favorite house price indicator from First American CoreLogic’s LoanPerformance ...
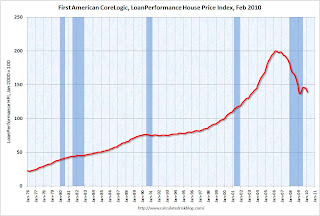 This graph shows the national LoanPerformance data since 1976. January 2000 = 100.
The index is up 0.3% over the last year and off 30.6% from the peak.
House prices are off 4.9% from the recent peak in August 2009 (although some of the decline is seasonal).
 This graph shows the nominal not seasonally adjusted Composite 10 and Composite 20 indices (the Composite 20 was started in January 2000).
The Composite 10 index is off 30.0% from the peak, and up slightly in February (SA).
The Composite 20 index is off 29.3% from the peak, and down slightly in February (SA).
 The next graph shows the price declines from the peak for each city included in S&P/Case-Shiller indices.
Prices decreased (SA) in 15 of the 20 Case-Shiller cities in February.
Prices in Las Vegas are off 55.7% from the peak, and prices in Dallas only off 6.0% from the peak.
The Census Bureau reported the homeownership and vacancy rates for Q1 2010 this morning.
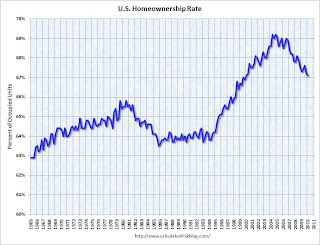 The homeownership rate declined to 67.1%. This is the lowest level since Q1 2000.
 Note: graph starts at 60% to better show the change.
The homeownership rate increased in the '90s and early '00s because of changes in demographics and "innovations" in mortgage lending. The increase due to demographics (older population) will probably stick, so I've been expecting the rate to decline to the 66% to 67% range - and not all the way back to 64% to 65%.
Best wishes to all.


