 RSS Feed
 by Calculated Risk on 5/31/2010 09:13:00 AM
Monday, May 31, 2010
Real PCE Growth in Q2
Note: Here is the Weekly Summary and a Look Ahead (it will be a busy week).
On Friday, the BEA released the Personal Income and Outlays report for April. The report showed that Real PCE increased less than 0.1 percent in April (compared to March).
Even though the month-to-month increase was small, this was fairly large increase from January (comparing the first month of Q2 to the first month of Q1).
In calculating PCE for the GDP report, the quarterly change in PCE is based on the change from the average in one quarter, compared to the average of the preceding quarter.
The following graph illustrates how this is calculated. Note that the y-axis doesn't start at zero to better show the change.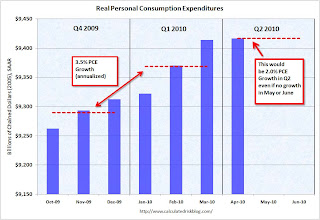 Click on graph for large image.
The blue columns show real PCE by month, and the dashed red lines are the quarterly average.
PCE didn't increase much in January compared to December either, but there was strong growth in February and March. This resulted in PCE growing at an annualized rate of 3.5% for Q1.
Even if PCE was flat in May and June compared to April (preliminary reports suggest growth in May), real PCE would grow at 2.0% in Q2. More likely - with some growth in May and June - PCE will grow closer to 3% in Q2.
This is just a reminder that PCE growth (and GDP growth) is pretty much already baked into Q2.
Best to all.


