 RSS Feed
 by Calculated Risk on 5/03/2010 08:33:00 AM
Monday, May 03, 2010
March Personal Income up 0.3%, Spending Increases 0.6%
The BEA released Q1 data on Friday, and here is the March data from the BEA: Personal Income and Outlays, March 2010
Personal income increased $36.0 billion ... Personal consumption expenditures (PCE) increased $58.6 billion, or 0.6 percent.Once again spending increased much faster than income ... meaning the saving rate declined again.
...
Real PCE -- PCE adjusted to remove price changes -- increased 0.5 percent in March, the same increase as in February.
...
Personal saving -- DPI less personal outlays -- was $304.0 billion in March, compared with $332.2 billion in February. Personal saving as a percentage of disposable personal income was 2.7 percent in March, compared with 3.0 percent in February.
 Click on graph for large image.
This graph shows the saving rate starting in 1959 (using a three month trailing average for smoothing) through the March Personal Income report. The saving rate fell to 2.7% in March.
I still expect the saving rate to rise over the next couple of years slowing the growth in PCE.
The following graph shows real Personal Consumption Expenditures (PCE) through March (2005 dollars). Note that the y-axis doesn't start at zero to better show the change.
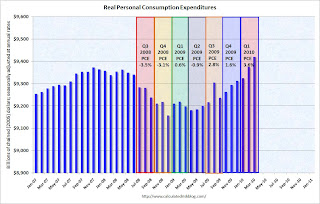 The quarterly change in PCE is based on the change from the average in one quarter, compared to the average of the preceding quarter.
The colored rectangles show the quarters, and the blue bars are the real monthly PCE.
The increase in PCE in March was strong and PCE increased 3.6% SAAR in Q1 2010. This increase in spending was driven by less saving and transfer payments.
The National Bureau of Economic Research (NBER) uses several measures to determine if the economy is in recession. One of the measures is real personal income less transfer payments (see NBER memo). This was flat in March at $9,039.4 billion (SAAR) compared to 9,037.5 billion in February, and is barely above the low of September 2009 ($9,000 billion).
 This graph shows real personal income less transfer payments since 1969.
This measure of economic activity is moving sideways - similar to what happened following the 2001 recession.
This is a solid report for PCE, but PCE growth is not sustainable without jobs and income growth.


