 RSS Feed
 by Calculated Risk on 4/23/2010 10:00:00 AM
Friday, April 23, 2010
New Home Sales at 411K in March
The Census Bureau reports New Home Sales in March were at a seasonally adjusted annual rate (SAAR) of 411 thousand. This is an increase from the revised rate of 324 thousand in February (revised from 308 thousand). Click on graph for larger image in new window.
The first graph shows monthly new home sales (NSA - Not Seasonally Adjusted).
Note the Red columns for 2010. In March 2010, 38 thousand new homes were sold (NSA).
The record low for March was 31 thousand in 2009.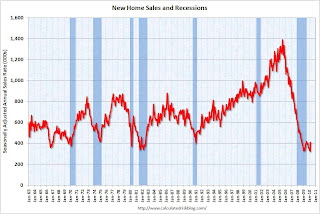 The second graph shows New Home Sales vs. recessions for the last 45 years.
Sales of new single-family houses in March 2010 were at a seasonally adjusted annual rate of 411,000 ... This is 26.9 percent (±21.1%) above the revised February rate of 324,000 and is 23.8 percent (±18.7%) above the March 2009 estimate of 332,000.And another long term graph - this one for New Home Months of Supply.
 Months of supply declined to 6.7 in March from 8.6 in February. This is significantly below the all time record of 12.4 months of supply set in January 2009, but still higher than normal.
The seasonally adjusted estimate of new houses for sale at the end of March was 228,000. This represents a supply of 6.7 months at the current sales rate.
 The final graph shows new home inventory.
 New home sales are counted when the contract is signed, so this pickup in activity is probably related to the tax credit. Note that that a few thousand extra sales NSA in March can make a huge difference in the SAAR.
Any further pickup in sales because of the tax credit will happen in April and then sales will probably decline again.


