by Calculated Risk on 2/12/2010 11:51:00 AM
Friday, February 12, 2010
Inventory Cycle and GDP
In Q4 2009 a majority of the increase in GDP was due to changes in private inventories. That can be a little confusing ...
First, GDP is Gross Domestic Production. What is being estimated is "domestic production", but what is being measured is mostly domestic consumption.
Right away we can see that if something is produced domestically and then exported, it will not show up in domestic sales. So exports are added to the equation, and imports subtracted. Investment and Government spending are also added to measures of consumption, and we frequently see an equation like this for GDP:
Y: GDP
C: Consumption
I: Investment
G: Government spending
NX: Exports - imports.
But what about changes in inventories? The same ideas apply. What is measured are sales and changes in inventory, and then production is calculated:
The following simple table shows how this works, and how it impacts GDP.
| Sales | Production | Inventory | I/S | GDP | |
|---|---|---|---|---|---|
| Q1 | 100 | 100 | 100 | 1.00 | -- |
| Q2 | 101 | 101 | 100 | 0.99 | 4.1% |
| Q3 | 102 | 102 | 100 | 0.98 | 4.0% |
| Q4 | 103 | 103 | 100 | 0.97 | 4.0% |
| Q5 | 100 | 104 | 104 | 1.04 | 3.9% |
| Q6 | 97 | 100 | 107 | 1.10 | -14.5% |
| Q7 | 97 | 96 | 106 | 1.09 | -15.1% |
| Q8 | 98 | 93 | 101 | 1.03 | -11.9% |
| Q9 | 99 | 98 | 100 | 1.01 | 23.3% |
| Q10 | 100 | 100 | 100 | 1.00 | 8.4% |
The first four quarters just show normal growth. Sales increase by one unit each quarter, and since inventory is steady, production increases with sales. This gives annualized GDP growth of 4%, and a slightly declining inventory-to-sales ratio (assuming inventory stay at the same level).
Now look at Q5. Sales suddenly drop, but production still increases since the decline in sales was a surprise. This pushes up inventories. Production is measured from sales (100) plus increase in inventory (+4) and GDP still increases.
Now in Q6 sales fall further to 97. The company reacts to the decline in sales and only produces 100 widgets. Inventory still increases (+3), but the combination of sales and inventory changes in Q6 is less than in Q5, so GDP declines sharply (marked in red).
In Q7 sales have bottomed, but the company is still cutting back on producton because they have too much inventory. For Q7, Production = Sales (97) plus changes in inventory (-1) giving production of 96 widgets. That is sharply below the 100 widget production of the prior quarter, so even though sales have bottomed, GDP declines sharply.
In Q8 sales increase slightly, but the company still has too much inventory, and they cut production further - resulting in a decline in GDP.
Finally in Q9, sales increase again by one unit, and the company can now increase production almost to the level of sales. Inventory is still declining (production is less than sales), but production has increased sharply compared to Q8. This shows up as a surge in GDP of 23% in this example.
Remember production in Q9 was calculated from sales and changes in inventory. Production of 98 widgets = Sales of 99 widgets, minus 1 unit for decline in inventory. The increase in production from 93 units in Q8 to 98 unites in Q9 is what shows up in the GDP report.
By Q10 sales and production are pretty much back in equilibrium, but at a lower level than the peak. Now further increases in production depend on increases in sales.
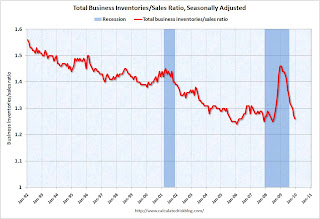
And that brings us to the Manufacturing and Trade Inventories and Sales report from the Census Bureau today that showed inventories declined slightly in December (seasonally adjusted).
 Click on graph for larger image in new window.
The Census Bureau reported:
Inventories. Manufacturers’ and trade inventories, adjusted for seasonal variations but not for price changes, were estimated at an end-of-month level of $1,310.7 billion, down 0.2 percent (±0.1%) from November 2009 and down 9.7 percent (±0.4%) from December 2008.This report suggests that inventories are back in line with sales, and the inventory cycle is mostly over (there will probably still be a positive contribution in Q1 2010 from changes in private inventories). Further increases in production will now depend on increases in consumption (or exports).
Inventories/Sales Ratio. The total business inventories/sales ratio based on seasonally adjusted data at the end of December was 1.26. The December 2008 ratio was 1.46.


