by Calculated Risk on 1/11/2010 12:18:00 PM
Monday, January 11, 2010
Bubbles and Employment
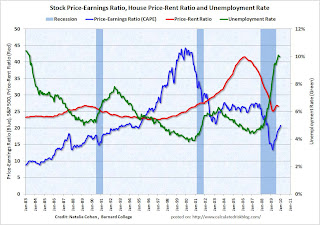
The following graph is from a forthcoming paper by Natalia Cohen, a senior at Barnard College.
Note: the price-earnings and price-rent portion is based on a graph by Paul Krugman, "The Return of Depression Economics and the Crisis of 2008", pg. 145
The graph shows the 10 year stock price-earnings ratio as calculated by Robert Shiller (see here for data and an explanation).
The price-rent ratio is based on work by Fed economist John Krainer and researcher Chishen Wei: "House Prices and Fundamental Value". This calculation uses the American CoreLogic LoanPerformance House Price Index and Owners' Equivalent Rent (Jan 2000 = 25 for convenience).
The unemployment rate is from the BLS. Click on graph for larger image.
The graph clearly shows the recent stock and house price bubbles. The smaller late '80s housing bubble is also evident.
The overlay of the unemployment rate on the graph (green) suggests that asset bubbles push down the unemployment rate, and then when the bubbles burst, the unemployment rate increases significantly. There are other factors too, but the bursting of the bubble probably leads to higher sustained unemployment because many workers have non-transferable skills and need to acquire a new skill set.
A good example of this would be construction employment in the recent bubble. The second graph shows residential building construction employment and the price-rent ratio. The increase in residential construction employment in the late '90s was probably due to the stock bubble, but there was a clear increase in employment related to the housing bubble in the late '80s, and the also during the more recent housing bubble.
Note: Scales do not start at zero to better show the change. Also this is just residential building construction employment - unfortunately the BLS didn't track residential speciality construction employment separately until 2001. The third graph compares total construction employment and the price-rent ratio. Some of the increase in the late '90s was due to non-residential construction.
As we know, there were bubble in both residential and non-residential investment. This pushed up both key categories of construction employment.
Since the recovery in residential construction will probably be sluggish, and private non-residential construction spending is declining rapidly - construction employment will probably continue to decline even with more public spending.
A construction industry group is now arguing that almost one-in-four construction workers is unemployed. But that reality is many of these jobs are not coming back any time soon because the bubbles in residential and non-residential investment pushed construction employment up way too high - and now many of these "unemployed" construction workers will need to develop new skill sets and find alternative employment.
This wasn't the workers fault - they were just responding to the market demand, and construction employment was probably the highest paying job available. However this does suggest that the Fed needs to consider asset bubbles when trying to follow their dual mandate of price stability and maximum sustainable employment. Asset bubbles play a key role in employment, and trying to clean up after the bubble is short term thinking and is not promoting sustainable employment.


