by Calculated Risk on 12/13/2009 02:36:00 PM
Sunday, December 13, 2009
Summary and a Look Ahead
Some key real estate news will be released this week including the Housing Market Index on Tuesday, Housing Starts (November) and the Architecture Billings Index for CRE (both on Wednesday).
In other economic news, the Fed will release Industrial Production and Capacity Utilization (November) on Tuesday, and the FOMC meeting announcement on Wednesday (no change). CPI will be released on Wednesday and the Philly Fed Index on Thursday.
And a summary of last week ...
From the BLS: Job Openings and Labor Turnover Summary The following graph shows job openings (yellow line), hires (blue Line), Quits (green bars) and Layoff, Discharges and other (red bars) from the JOLTS. Red and green added together equals total separations.
 Click on graph for larger image in new window.
Notice that hires (blue line) and separations (red and green together) are pretty close each month. When the blue line is above total separations, the economy is adding net jobs, when the blue line is below total separations, the economy is losing net jobs.
According to the JOLTS report, there were 3.966 million hires in October, and 4.203 million separations, or 237 thousand net jobs lost. With job openings and hires near record lows, this suggests the current labor problem is mostly a lack of new jobs although layoffs and discharges were still elevated in October.
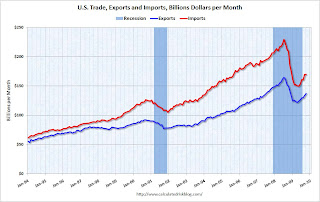
The Census Bureau reported: "The ... total October exports of $136.8 billion and imports of $169.8 billion resulted in a goods and services deficit of $32.9 billion, down from $35.7 billion in September, revised."
 This graph shows the monthly U.S. exports and imports in dollars through October 2009.
Imports and exports both increased in October. On a year-over-year basis, exports are off 9% and imports are off 19%.
Import oil prices decreased slightly to $67.39 in October - and oil import volumes dropped sharply in October. The decline in oil imports was the major contributor to decrease in the trade deficit.
 The Treasury reported 31,382 HAMP permanent modifications as of the end November.
 Here is the link at Treasury. See here for a list of reports.
The rules to include a borrower in a trial modification program vary by servicer - and that makes that number essentially meaningless. The number that matters is the permanent mods, and although early, it appears the program will fall short of the original goal.
The Fed released the Q3 2009 Flow of Funds report this week: Flow of Funds.
According to the Fed, household net worth is now off $11.9 Trillion from the peak in 2007, but up $4.9 trillion from the trough earlier this year.
 This is the Households and Nonprofit net worth as a percent of GDP.
This includes real estate and financial assets (stocks, bonds, pension reserves, deposits, etc) net of liabilities (mostly mortgages). Note that this does NOT include public debt obligations.
This really shows the recent stock and real estate bubbles.
Also, the following Mortgage Equity Withdrawal estimate is calculated from the Fed's Flow of Funds data and the BEA supplement data on single family structure investment. (See: Q3 2009: Mortgage Equity Extraction Strongly Negative)
 This graph shows the net equity extraction, or mortgage equity withdrawal (MEW), results, using the Flow of Funds (and BEA data) compared to the Kennedy-Greenspan method.
 For Q3 2009, the Net Equity Extraction was minus $91 billion, or negative 3.3% of Disposable Personal Income (DPI). This is not seasonally adjusted.
On a monthly basis, retail sales increased 1.3% from October to November (seasonally adjusted), and sales are up 1.9% from November 2008.
 This graph shows retail sales since 1992. This is monthly retail sales, seasonally adjusted (total and ex-gasoline).
This shows that retail sales fell off a cliff in late 2008, and appear to have bottomed, but at a much lower level.
The red line is for retail sales ex-gasoline and this shows there might be a little pickup in final demand.
"In summary, it is encouraging to find that, despite the rapid growth of mortgage debt, only a small fraction of households across the country have loan-to-value ratios greater than 90 percent. Thus, the vast majority of homeowners have a sizable equity cushion with which to absorb a potential decline in house prices."
Alan Greenspan, Sept, 2005
Best wishes to all.


