by Calculated Risk on 12/12/2009 07:37:00 PM
Saturday, December 12, 2009
FDIC Bank Failure Update
Here is a graph of bank failures, by number of institutions and assets, from the December Congressional Oversight Panel’s Troubled Asset Relief Program report. (ht Catherine Rampell):  Click on graph for larger image in new window.
From the report (page 45):
Figure 11 shows numbers of failed banks, and total assets of failed banks since 1970. It shows that, although the number of failed banks was significantly higher in the late 1980s than it is now, the aggregate assets of failed banks during the current crisis far outweighs those from the 1980s. At the high point in 1988 and 1989, 763 banks failed, with total assets of $309 billion.167 Compare this to 149 banks failing in 2008 and 2009, with total assets of $473 billion.168Note: This is in 2005 dollars and this includes the failure of WaMu in 2008 with $307 billion in assets that didn't impact the DIF.
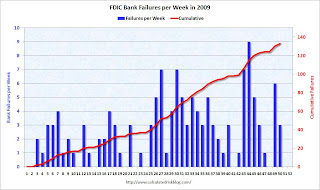
The second graph shows bank failures by week in 2009.
 Note: Week 1 on graph ended Jan 2nd.
There have been 133 bank failures this year, and there are only two more weeks left to close banks in 2009 (Dec 18th and maybe Dec 24th). This will set the over-under line for 2010 - will there be more bank failures in 2010 than in 2009?
I'll take the over (more failures in 2010 than in 2009).


