by Calculated Risk on 2/09/2009 02:44:00 PM
Monday, February 09, 2009
Job Losses During Recessions
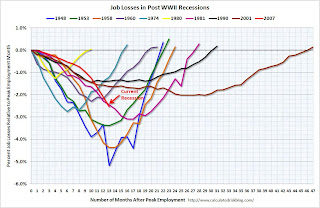
Barry Ritholtz provides us with the following chart: Job Losses in Post WWII Recessions Click on graph for larger image in new window.
This graph shows job losses during recessions from the peak month of employment until jobs recover.
The current recession has had the most job losses and the 2001 recession had the weakest job recovery.
However this graph is not normalized for increases in the work force. The second graph (that Barry asked me for) shows the job losses from the start of the employment recession, in percentage terms (as opposed to the number of jobs lost).
For the current recession, employment peaked in December 2007, and this recession is about as bad as the 1981 recession in percentage terms at this point.
In the earlier post-war recessions, there were huge swings in manufacturing employment. Now manufacturing is a much smaller percentage of the economy, and the swings aren't as significant because of technological advances. This is the main reason that job losses were larger in those earlier recessions.
Here is Barry's updated post (with another graph). Barry asks: Are recessions taking longer to recover from? The answer appears to be yes. And I expect unemployment to be elevated for some time (even after the economy starts to recover).


