by Calculated Risk on 1/28/2009 05:59:00 PM
Wednesday, January 28, 2009
Architecture Billings Index as a Leading Indicator of Construction Spending
Back in 2005, Kermit Baker and Diego Saltes of the American Institute of
Architects wrote a white paper: Architecture Billings as a Leading Indicator of Construction
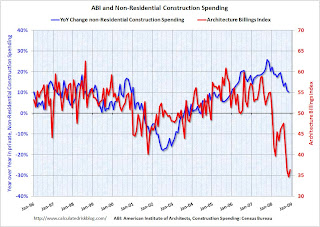
Here is a graph from their paper: Click on graph for larger image in new window.
This graph from 2005 compares the Architecture Billings Index from the American Institute of Architects and year-over-year change in non-residential construction spending from the Census Bureau. The correlation is pretty strong (see the paper for more). The second graph is an update through Dec 2008 for the ABI, and Nov 2008 for construction spending.
I've had to change the scale to fit the collapse in the ABI on the graph.
The ABI typically leads construction spending by about 9 to 12 months according to AIA chief economist Kermit Baker. This graph also suggests the collapse will be very sharp, and although there isn't enough data to know if this is predictive of the percentage decline in spending, it does suggest a possible year-over-year decline of perhaps 30% in non-residential construction spending.
In November, private non-residential construction spending was at $428.2 billion annual rate. A 30% decline would be to an annual rate of $300 billion or so. Ouch.


