by Calculated Risk on 11/19/2008 08:55:00 PM
Wednesday, November 19, 2008
DOT: U.S. Vehicle Miles Off Sharply in September
The Dept of Transportation reports on U.S. Traffic Volume Trends:
Travel on all roads and streets changed by -4.4% (-10.7 billion vehicle miles) for September 2008 as compared with September 2007. Travel for the month is estimated to be 232.8 billion vehicle miles.
 Click on graph for larger image in new window.
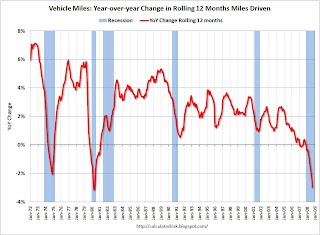
This graph shows the annual change in the rolling 12 month average of U.S. vehicles miles driven. Note: the rolling 12 month average is used to remove noise and seasonality.
By this measure, vehicle miles driven are off 3.0% YoY, and the decline in miles driven is worse than during the early '70s oil crisis - and about the same as the 1979-1980 decline. As the DOT noted, miles in September 2008 were 4.4% less than September 2007, so the YoY change in the rolling average will probably get worse.
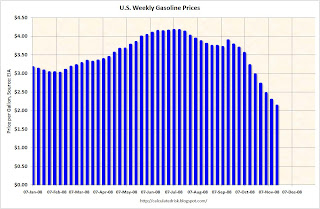
 The second graph shows the weekly U.S. gasoline prices from the EIA. This shows that gasoline prices really declined in October - but prices in September were still over $3.50 per gallon. So we will have to wait for the October vehicle miles report to see the impact of sharply lower gasoline prices.
 Lower gasoline prices should mean more vehicle miles driven, but the weakening economy might offset the impact from lower prices.


