by Calculated Risk on 11/10/2008 01:32:00 PM
Monday, November 10, 2008
Credit Crisis Indicators: Little Progress
A daily update ... day to day there has been little progress, but overall most indicators have improved since the crisis started.
As an example, the LIBOR is down sharply from 4.82% on Oct 10th to 2.24% today. And the TED spread is at 2.0% from 4.63%. The progress is slow, but there has been progress.
The London interbank offered rate, or Libor, that banks say they charge each other for such loans declined 5 basis points to 2.24 percent today, the lowest level since November 2004, the British Bankers' Association said.The three-month LIBOR was at 2.29% on Friday. The rate peaked at 4.81875% on Oct. 10. (Better)
With the effective Fed Funds rate at 0.23% (as of Friday), this is probably somewhat in the right range. At some point, I'd like to see the effective Fed funds rate close to the target rate (currently 1.0%).
The TED spread is around 2.0, but still too high. The peak was 4.63 on Oct 10th. I'd like to see the spread move back down to 1.0 or lower. A normal spread is about 0.5.
Here is a list of SFP sales. It has been a few days without an announcement from the Treasury... (no progress).

Click on graph for larger image in new window.
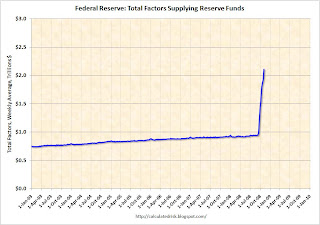
The Federal Reserve assets increased $105 billion last week to $2.075 trillion. Note: the graph shows Total Factors Supplying Federal Reserve Funds and is an available series that is close to assets.
So far the Federal Reserve assets are still increasing rapidly. It will be a good sign - sometime in the future - when the Fed assets start to decline.
 Graph from the Fed.
This is the spread between high and low quality 30 day nonfinancial commercial paper.
The Fed is buying higher quality commercial paper (CP) and this is pushing down the yield on this paper (0.82% yesterday!) - and increasing the spread between AA and A2/P2 CP. So this indicator has been a little misleading. But it now sounds like the Fed might intervene in other companies and just the talk of possible Fed action is probably pushing down the A2/P2 rates. If the credit crisis eases, I'd expect a significant decline in this spread.
The LIBOR is down and the TED spread is flat - so there is little progress today - and any progress is coming directly from Fed intervention and increases in the Fed balance sheet, so there is still a long way to go.


