by Calculated Risk on 12/26/2007 02:01:00 PM
Wednesday, December 26, 2007
Los Angeles Real House Prices
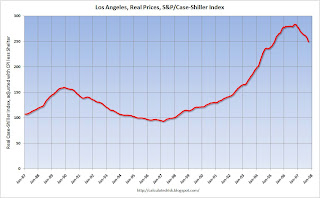
The first graph shows real house prices in Los Angeles based on the S&P/Case-Shiller house price index. Nominal prices are adjusted with CPI less shelter from the BLS. Click on graph for larger image.
After the peak in December 1989, prices in Los Angeles fell 41.4% over about 7 years, in real terms (adjusted for inflation). (Note: using the OFHEO series, real prices declined 34% in LA in the early '90s).
So far, in the current bust, nominal prices have declined almost 9% in LA, and about 12% in real terms. The second graph aligns, in time, the December 1989 price peak with the October 2006 peak.
The horizontal scale is the number of months before and after the price peak.
In 1990, real prices had declined 9.3% during the first 12 months after the price peak. For the current bust, real prices have declined 12% for the same period.
This suggests that price declines have just started, and that there will be several more years of price declines in the bubble areas.


