 RSS Feed
 by Calculated Risk on 12/29/2006 02:56:00 PM
Friday, December 29, 2006
Housing in 2007
For the overall U.S. economy in 2007, the overwhelming consensus view is for a soft landing, with real GDP growth between 2.5% and 3.0%. Although there are several frequently mentioned risks to this view - such as inflation, higher energy prices, a currency crisis, exogenous events - the housing market is probably the main downside risk to the economy.
So how will the housing market perform in 2007?
Let's start with what we know:
1) Inventories are at record levels.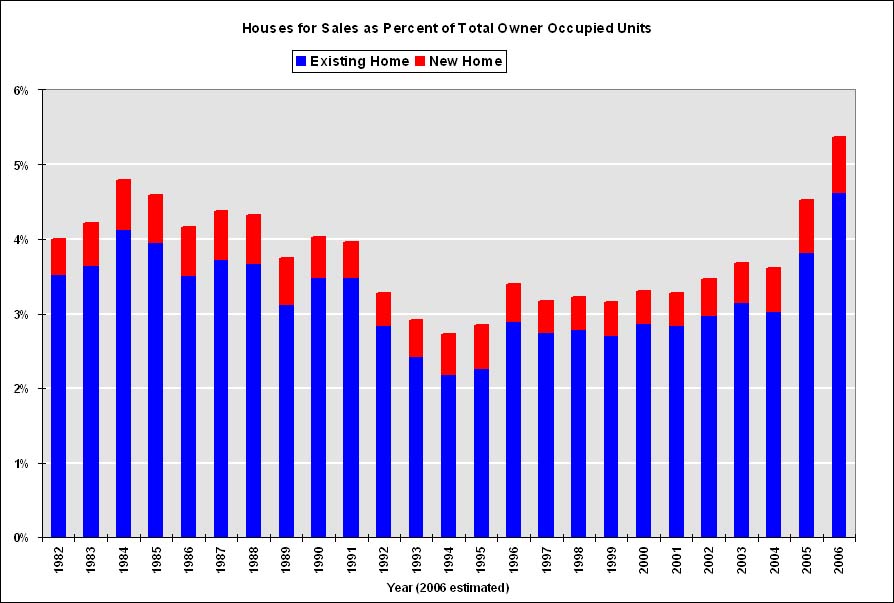 Click on graph for larger image.
This graph shows the total houses for sale (existing and new) as a percent of total owner occupied units. Year 2006 is estimated as 3.5 million existing homes and 0.55 million new homes for sale. Both of these estimates might be low; at the end of November there were 3.82 million existing homes for sales, and if cancellations are included in new home inventory, there are probably close to 0.65 million new homes for sale.
But even with these conservative estimates, 2007 will be starting off with a record number of houses for sale.
2) Households are already dedicating a record percentage of their income to mortgage obligations.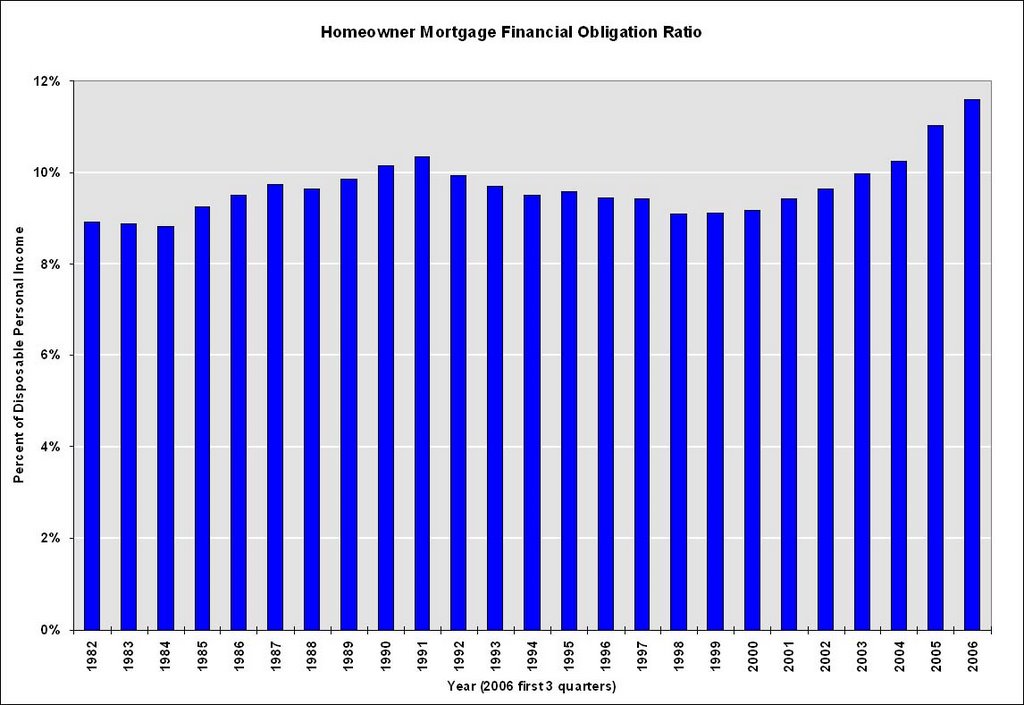 Source: Federal Reserve
As the Fed notes, the important aspect of this series are the changes in household debt service obligations. Even with historically low interest rates, households are already dedicating a record portion of their income to mortgage obligations.
3) Homeowners have a record low percentage of equity in their homes.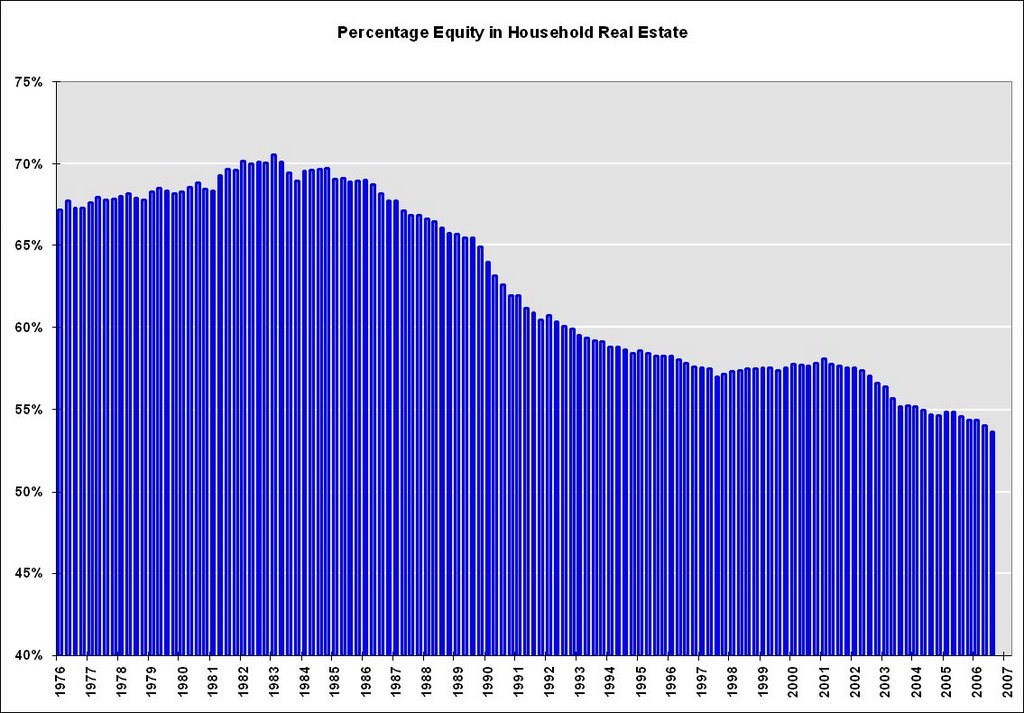 Note: Graph doesn't start at zero to better show change in percent equity.
The Fed recently reported that homeowner equity, as a percent of market value, fell to a record low 53.6%, compared to 54.0% in Q2, and 54.6% one year ago.
This probably indicates that more and more homeowners have maxed out their "home ATM". More on this later.
And now let's add what we're pretty certain will happen:
4) We will see record residential construction job losses in 2007.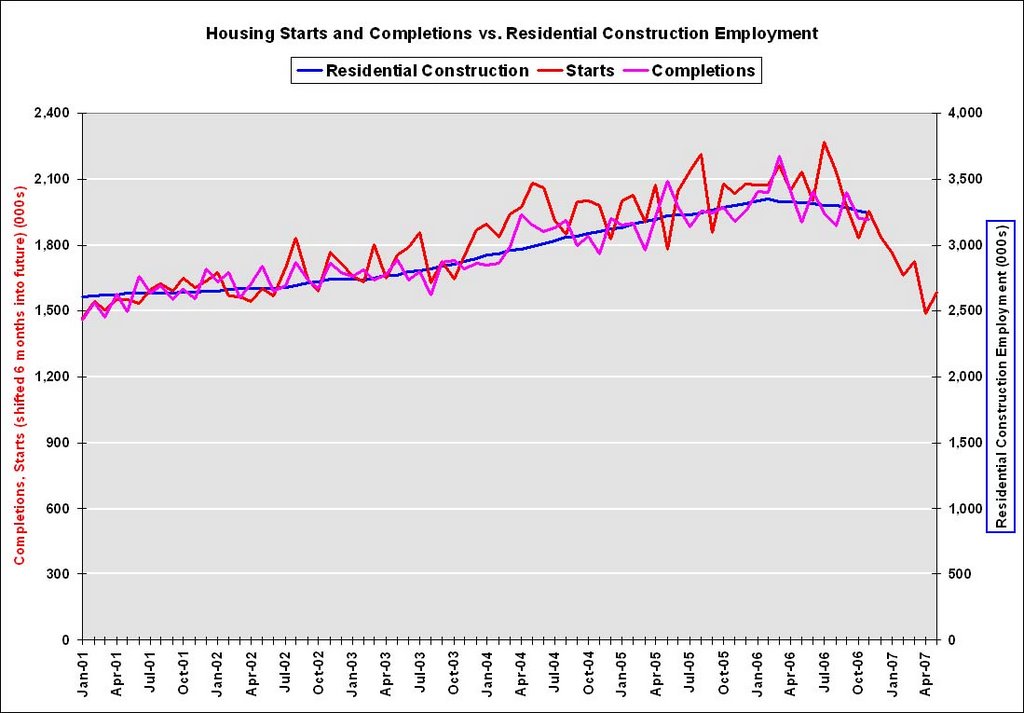
This graph shows starts, completions and residential construction employment. (starts are shifted 6 months into the future). Completions and residential construction employment are highly correlated, and Completions lag Starts by about 6 months.
Based on historical correlations, it is reasonable to expect Completions and residential construction employment to follow Starts "off the cliff". This would indicate the loss of 400K to 600K residential construction employment jobs over the next 6 months.
5) Foreclosures will be approaching record levels in some states. Source: DataQuick through Q3 2006. 2007 estimated at Q4 2006 rate.
This graph shows the number of Notice of Defaults (NODs) filed in California since 1992. Although DataQuick has only released data through Q3, it now appears 2006 will have the highest number of defaults since 1998. At the current pace, 2007 might see a record number of NODs.
Less certain is the amount of overbuilding that occurred in recent years.
6) In earlier posts here and here, I tried to estimate the amount of recent overbuilding. This is important for estimating how far starts might fall in 2007.
Let's put it together and make some predictions for 2007.
A) House Prices will decline: The current record inventory, and the impending foreclosures, will put pressure on prices in 2007. This fits the historical pattern; typically the second year of a housing bust is when prices start to fall. Usually housing busts are local, but since this boom was widespread, the bust will probably be widespread.
I've seen a variety of estimates for 2007. UBS is projecting a 10% price decline in '07. Pimco's Parikh thinks nominal prices will be flat:
"We believe nationwide home prices -- as measured by the federal OFHEO repeat sales index -- will be roughly unchanged in 2007. O.C. prices, on same scale, likely down 5 percent or so. The risk to our price forecast is to the downside."My estimate is prices will fall nominally by 1% to 3% nationwide by all measures (OFHEO, NAR).
The reason for the projection of a small price decline, even with record levels of inventory, is that real estate prices display strong persistence and are sticky downward. So housing "bubbles" typically do not "pop", rather prices deflate slowly in real terms, over several years. Sellers tend to want a price close to recent sales in their neighborhood, and buyers, sensing prices are declining, will wait for even lower prices.
So we have to distinguish between projections for 2007 and the entire bust cycle. As an example, Dr. Thornberg is projecting:
"Whether prices go down or stay the way they are, you can pretty much guarantee that whatever the value of your house now, that's going to be the value of your house in 2011."Over the course of the entire bust, Dr. Gary Shilling expects
"at least a 20% decline in median single-family house prices nationwide, and that number may be way understated."In an efficient market, prices would clear immediately, and we would see the entire price decline in a short period. However since prices are sticky, real estate markets do not clear immediately, and instead we see a drop in transactions, so ...
B) Transactions will decline.
Fannie Mae is projecting existing home sales will fall to 5.925 million units in '07 (from 6.425 million), and new home sales to 0.975 million units (from 1.05 million). I think both numbers might be optimistic.
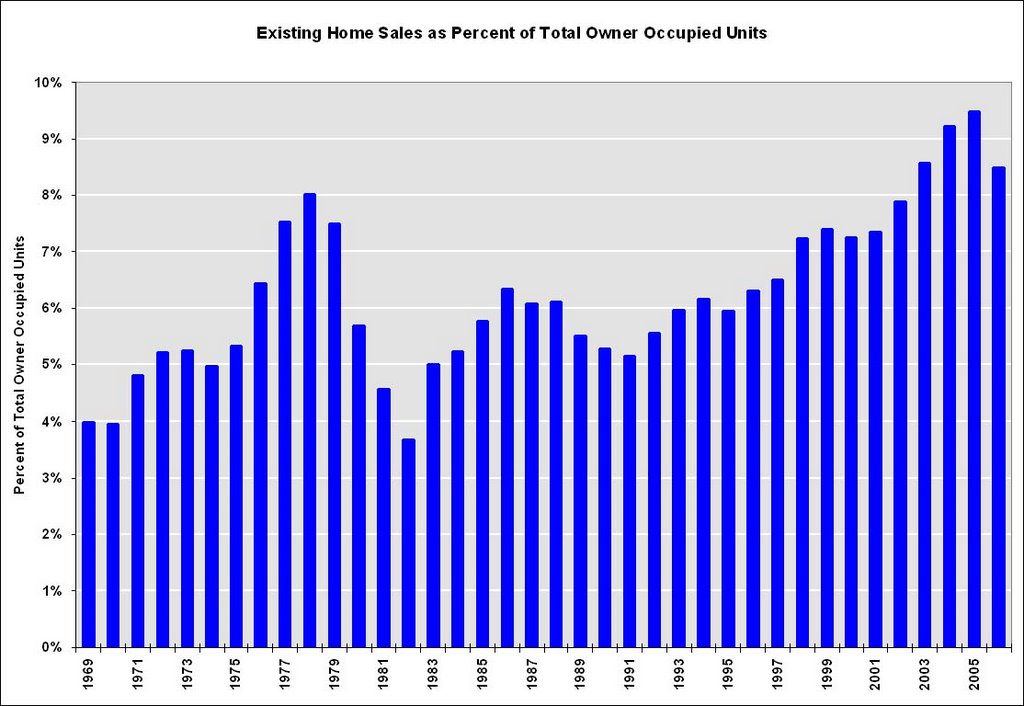 One of the rarely told stories of the housing boom was the jump in turnover of existing homes. This graph shows sales normalized by the number of owner occupied units. This shows the extraordinary level of sales for the last few years, reaching 9.5% of owner occupied units in 2005. The median level is 6.0% for the last 35 years.
Some of the sales were for investment and second homes, but normalizing by owner occupied units probably provides a good estimate of normal turnover. If sales fell back to 6% that would about 4.6 million units. If sales fell back to the level of 1998 to 2001 (7.3% of total owner occupied units sold) that would be about 5.6 million units in 2007.
With falling prices, my guess is existing home sales will "surprise" to the downside, perhaps in the 5.6 to 5.8 million unit range. Based on my estimate of overbuilding in recent years (see point 6 above), I believe new home sales will also surprise to the downside.
C. Mortgage Equity Withdrawal will decline.
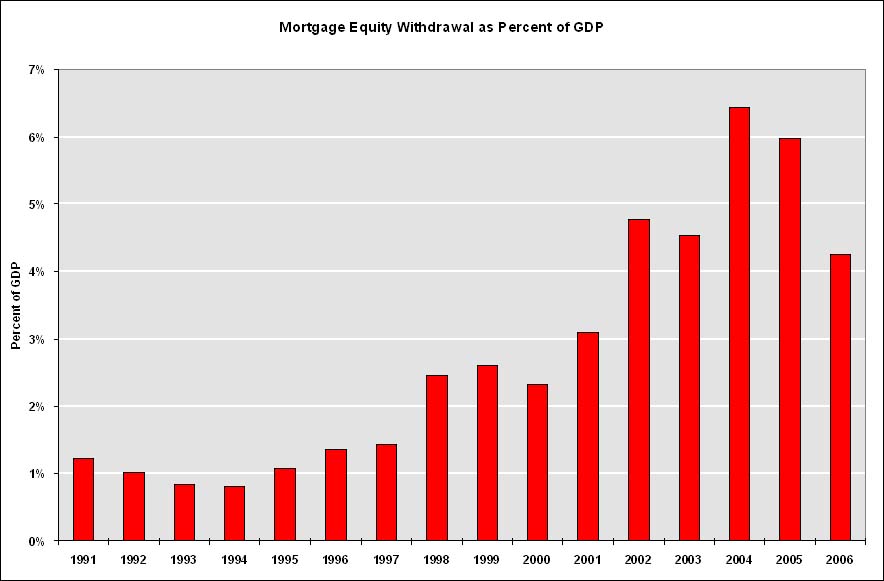 This graph shows Mortgage Equity Withdrawal (MEW) as a percent of GDP, using the Greenspan-Kennedy method.
With stable or falling home prices, already record mortgage obligations, and a record low percentage of equity in their home, MEW will probably be significantly less in 2007. The impact on consumer spending is unclear, but it will be a drag on economic growth.
This gives an overview of the 2007 housing market: falling prices, falling sales, falling residential construction employment, falling starts, falling MEW, falling percentage of equity, and rising foreclosures.
Will this be enough to tip the economy into recession? I still don't know, but I'll make a prediction before the year starts.


