 RSS Feed
 by Calculated Risk on 9/22/2006 05:35:00 PM
Friday, September 22, 2006
GDP Growth: With and Without Mortgage Extraction
UPDATE: Please see the next post on why MEW that flows to imports wouldn't impact GDP as in graph 2.
The recent Flow of Funds report showed that household mortgages increased $220.3 Billion in Q2 2006, and $436.4 Billion for the first half of 2006. Using a simple formulation(1) for Mortgage Equity Withdrawal (MEW), MEW was $81.6 Billion in Q2 2006. This is substantially below the record $180.1 Billion of MEW in Q3 2005. Click on graph for larger image.
The first graph shows quarterly MEW as a percent of GDP for the last 30 years. There is substantial quarterly variability in MEW, but it appears MEW has fallen, as a percent of GDP, from the levels of the last few years.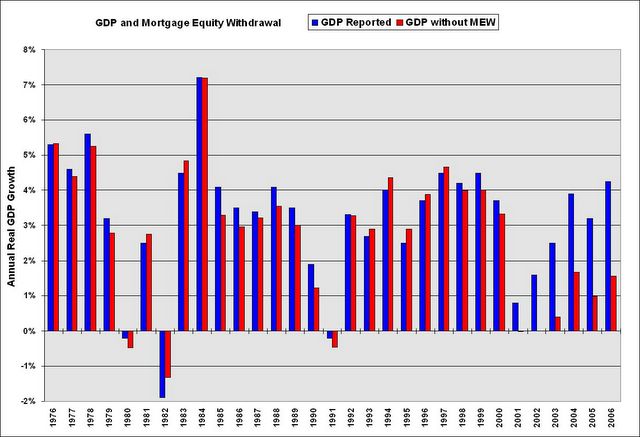 Using Greenspan's estimate of approximately 50% of MEW flowing through to personal consumption expenditures, it is possible to estimate the impact of MEW on GDP.
This graph, of annual real GDP growth for the last 30 years, clearly shows the unprecedented impact of MEW over the last few years.
(2006: first two quarters)
Using this method, the surge in MEW in the mid to late '80s boosted GDP by an average of about 0.5% per year. Over the last five years, MEW has boosted GDP by an average of 2.2% per year!
UPDATE NOTE: The above calculations and graph assumes that consumption is domestic. In reality a large portion of MEW related consumption probably flows to imports. I'll write more about this.
NOTE: Although this analysis matches MEW to GDP in the quarter the equity was extracted, there is probably a lag from extraction to consumption expenditures. As an example, someone might borrow money in Q4 and buy a new car in Q1 of the following year. So the strong equity extraction at the end of 2005 probably boosted GDP in Q1 2006.
Maybe 50% flowing through to consumption is too high, but the relative impact would be the same. And notice what happened in the early to mid 90s; MEW was negative and was a drag on consumption and GDP. MEW will probably be a drag on GDP for several years in the near future - maybe starting in 2007.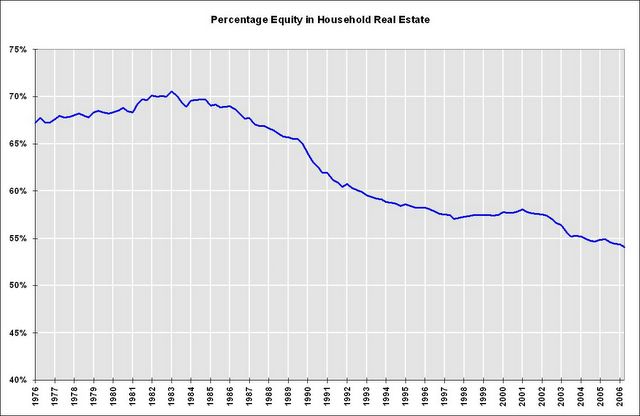 The final graph shows the percentage of equity in household real estate. Currently households have a record low 54.1% equity in their homes.
That may sound like a high percentage of equity, but according to Robert Broeksmit, Chairman of the Residential Board of Governors, Mortgage Bankers Association (from the Senate hearing on Wednesday):
"More than a third of homeowners, approximately 34 percent, own their homes free and clear."This group is probably risk adverse and it's unlikely they will borrow significantly on their homes to fuel consumption. So the debt burden falls on the other 66%.
On the third graph, notice that the percent equity dropped significantly from 1990 to 1996 - during the early '90s housing bust - even though MEW turned negative.
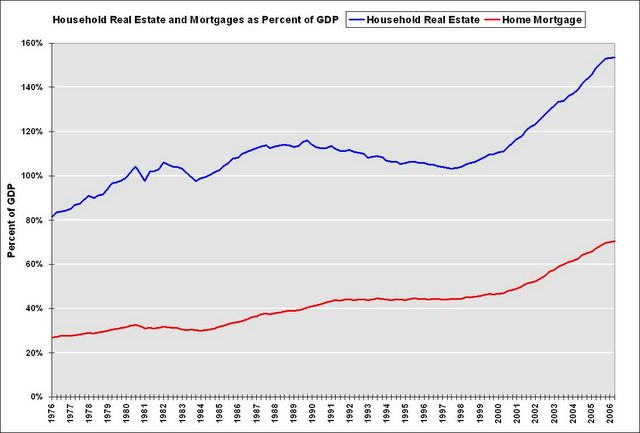 The fourth graph shows what happened during the '90s bust: the value of household real estate to GDP declined for several years, while the growth of mortgage debt kept pace with GDP growth. This lead to a significant decline in homeowners percentage of equity.
From early 1990 to 1996, the percent equity declined from 65% to 58%. Currently the percent equity is at a record low 54.1%. If something similar happens as in the early '90s, the percent equity could easily drop into the high 40% range in the next few years - and remember - that includes the 34% of homeowners with no debt.
This analysis leads me to believe that declining MEW over the next few years will be a significant drag on GDP growth.
Note 1: to calculate MEW, I subtracted 70% of residential investment (RI) from the increase in household mortgages. This is an approximation for identifying and excluding all mortgage debt for New Home purchases and home improvements. The reason I used 70% was a portion of RI is not borrowed, and a portion of RI is for apartments. This is not exact, but it is close.


