 RSS Feed
 by Calculated Risk on 9/04/2006 06:27:00 PM
Monday, September 04, 2006
Demographics and Housing Demand
I'm trying to answer one of the key housing questions: How far will New Home sales fall? This is a complicated question and, of course, the quantity demanded depends on the price - and homebuilders are already responding to the sluggish market by lowering their prices and / or offering incentives. So how quickly prices fall is a key determinate on how far New Home Sales decline.
This post is more modest; this is an overview of some of the demographic drivers of housing demand. This is a look at the national market. Note that demographic drivers in local markets will differ considerable from the national trends. As an example the population in Detroit is declining, and since housing is very durable, prices for existing homes are below replacement costs. (See Profile of Edward L. Glaeser)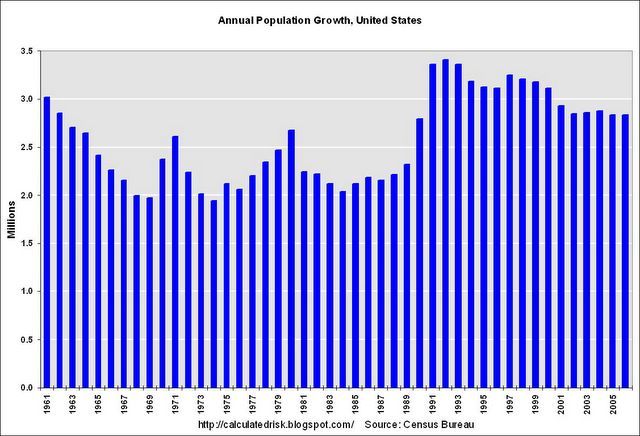 Click on graph for larger image.
The first key demographic for housing is population growth. This chart show the annual U.S. population growth according to the Census Bureau. The surge in the early '90s was probably a combination of the Baby Boom echo and perhaps immigration. But the key is that population growth is currently running about 2.85 million people per year. The second chart shows the trend of people per housing unit in the United States. The number of persons per unit was trending down until around 1990 and then flattened out. There was a rapid decrease in the '70s as the boomers started forming new households en masse.
Recently the number of people per housing unit has fallen slightly again. This could be due to people moving from renting to homeownership - leaving more vacant rental units. Another factor frequently cited by the National Association of Realtors is 2nd home purchases. A third possibility is speculative purchases.
Whatever the causes, changes in the ratio of people to housing units is a key driver for housing. In the '70s, there was more housing demand due to smaller household units, than due to the growth in the population. Conversely demand in the '90s was almost exclusively due to population growth, as household sizes stabilized. See the following table:
| Housing Added due to Population Growth and changes in Household Size | |||
| Decade | Due to Population Growth | Due to Change in Household Size | Total Housing Units Added |
| 1940s | 5.84 Million | 2.86 Million | 8.70 Million |
| 1950s | 9.11 | 3.08 | 12.19 |
| 1960s | 8.10 | 2.27 | 10.37 |
| 1970s | 9.05 | 10.65 | 19.70 |
| 1980s | 9.13 | 4.77 | 13.90 |
| 1990s | 13.47 | 0.13 | 13.60 |
| 2000s (through July '06) | 7.63 | 2.04 | 9.67 |
Predicting population growth and changes in household size are both important in predicting the need for new housing units. Since population growth is fairly predictable, understanding the reasons for changes in household sizes is the key to determining the number of new housing units needed.
Imagine if household sizes increase - even back to the 2000 level - the number of new housing units required for the remainder of the decade would be much lower than the first 6 years of the 2000s. With the high cost of homeownership, I wouldn't be surprised to see household sizes increase slightly over the next few years, at least until prices fall enough to spur demand.
When we talk about housing units that includes both owner occupied units and rentals. Let's take a look at the rental market:
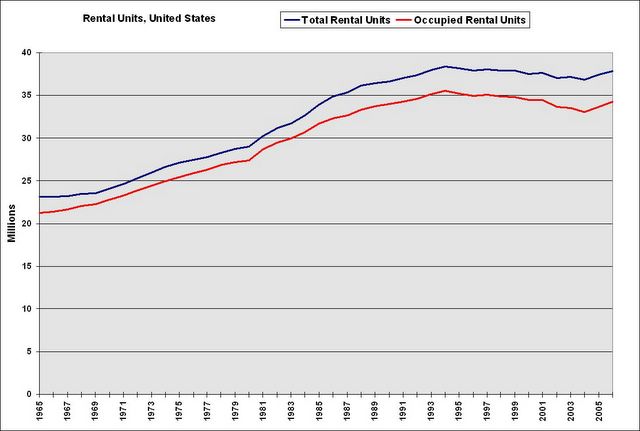 This graph shows the total number of rental units and occupied rental units in the United States. Notice the number of units rose in the '70s as baby boomers moved out of their parent's homes. The number continued to increase sharply in the '80s, but vacancy rates started climbing too. I think this shows there was over-building in the '80s, perhaps because of easy credit from the S&Ls, perhaps because builders were extrapolating demand from the recent past (the '70s).
Then the number of units started falling in the '90s. This probably means units were being converted to condos. In the early '00s, the number of apartments continued to decline as lower interest rates made ownership possible for many renters. Recently the number of apartments has started to increase again - since renting looks more attractive than owning for many Americans.
Mostly I write about New Home sales. New Home sales are from properties developed for sale. When we are talking about total housing units built in any year, we have to include houses built by the owner (either with or without a contractor) and new rentals units.
 As an example, in 2005 there were 1.932 million units completed, of which 1.385 million were built for sale, 308 thousand built by owner, and 239 thousand built as rentals.
New Home sales are units sold from the "Built for Sale" category only.
During the best decade for adding housing units (the '70s because of changes in household sizes) the U.S. added 1.97 million units per year. Last year, the same number of units were added, even though the demographics appear less favorable for housing (household sizes are fairly stable).
I still haven't answered the key question: How far will New Home sales fall? I'm still working on that ...

In Memoriam: Doris "Tanta" Dungey


| Privacy Policy |
| Copyright © 2007 - 2025 CR4RE LLC |
| Excerpts NOT allowed on x.com |