 RSS Feed
 by Calculated Risk on 2/10/2006 02:50:00 PM
Friday, February 10, 2006
More on Yield Curve
Here is a graph comparing the the yield curve for one year ago (Feb, 2005), six months ago (Aug, 2005), and yesterday. The data is from the US Treasury. (thanks to Doctorwho for link).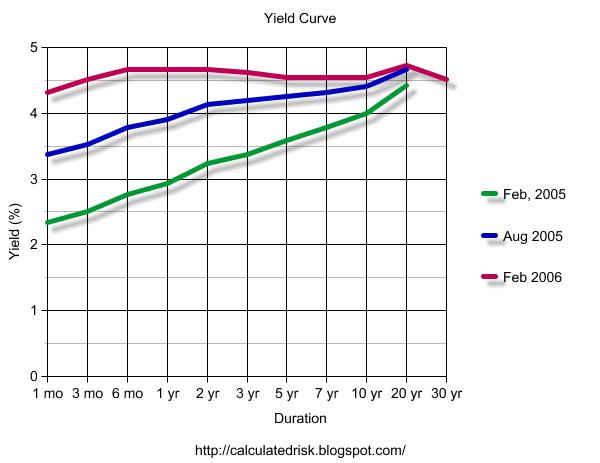
Click on graph for larger image.
The yield curve has definitely flattened out with a small inversion in the 6 months to 3 year time frame.
For some perspective, and a long term graph, see Dr. Kash's Interest Rate Update. To add to Kash's graph, the current spread between the 10 year yield and 6 month yield is -0.12.
For more long term graphs, see Dr. Hamilton's Inverted yield curve edges closer also from last November.


