 RSS Feed
 by Calculated Risk on 11/24/2022 11:28:00 AM
Thursday, November 24, 2022
Five Economic Reasons to be Thankful
Here are five economic reasons to be thankful this Thanksgiving. (Hat Tip to Neil Irwin who started doing this years ago)
1) The Unemployment Rate is Near 50 Year Low
 The unemployment rate was at 3.7% in October. The unemployment rate is down from 14.7% in April 2020 (the highest since the Great Depression).
The unemployment rate is down from 4.6% a year ago (October 2021).
This was just up from 3.5% in September - and that matched the lowest unemployment rate since 1969!
2) Low unemployment claims.
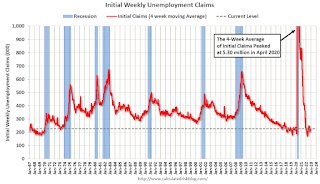 This graph shows the 4-week moving average of weekly claims since 1971.
2) Low unemployment claims.
 This graph shows the 4-week moving average of weekly claims since 1971.
Weekly claims were at 240,000 last week.
The dashed line on the graph is the current 4-week average.
The dashed line on the graph is the current 4-week average.
Even though weekly claims have moved up a little recently, the 4-week average is close to the lowest level in 50 years.
3) Mortgage Debt as a Percent of GDP is much lower than during Housing Bubble
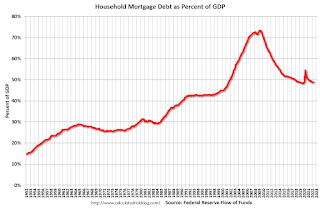 This graph shows household mortgage debt as a percent of GDP.
3) Mortgage Debt as a Percent of GDP is much lower than during Housing Bubble
 This graph shows household mortgage debt as a percent of GDP.
 Note this graph was impacted by the sharp decline in Q2 2020 GDP.
Mortgage debt is up $1.46 trillion from the peak during the housing bubble, but, as a percent of GDP is at 48.9%, down from a peak of 73.3% of GDP during the housing bust.
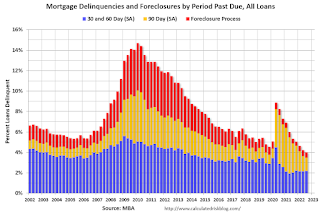
4) Mortgage Delinquency Rate at Lowest Level since at least 1979
Mortgage debt is up $1.46 trillion from the peak during the housing bubble, but, as a percent of GDP is at 48.9%, down from a peak of 73.3% of GDP during the housing bust.
4) Mortgage Delinquency Rate at Lowest Level since at least 1979

This graph, based on data from the MBA through Q3 2022, shows the percent of loans delinquent by days past due. Mortgage delinquencies were at the lowest level since the MBA survey started in 1979.
Note: The sharp increase in 2020 in the 90-day bucket was due to loans in forbearance (included as delinquent, but not reported to the credit bureaus).
The percent of loans in the foreclosure process increased year-over-year in Q3 with the end of the foreclosure moratoriums.
5) Household Debt burdens at Low Levels
 This graph, based on data from the Federal Reserve, shows the Total Debt Service Ratio (DSR), and the DSR for mortgages (blue) and consumer debt (yellow).
The Household debt service ratio was at 13.2% in 2007 and has fallen to under 10% now., and the DSR for mortgages (blue) are near the lowest level for the last 35 years.
This data suggests aggregate household cash flow is in a solid position.
This data suggests aggregate household cash flow is in a solid position.
Happy Thanksgiving to All!
Wednesday, November 23, 2022
Freddie Mac: Mortgage Serious Delinquency Rate decreased in October
by Calculated Risk on 11/23/2022 06:12:00 PM
Freddie Mac reported that the Single-Family serious delinquency rate in October was 0.66%, down from 0.67% September. Freddie's rate is down year-over-year from 1.32% in October 2021.
Freddie's serious delinquency rate peaked in February 2010 at 4.20% following the housing bubble and peaked at 3.17% in August 2020 during the pandemic.
These are mortgage loans that are "three monthly payments or more past due or in foreclosure".
 Click on graph for larger image
Mortgages in forbearance are being counted as delinquent in this monthly report but are not reported to the credit bureaus.
The serious delinquency rate was at 0.60% just prior to the pandemic - almost back to that level.
Note that multi-family delinquencies have been increasing and were at 0.15% in October.
Q4 GDP Tracking: Moving on up
by Calculated Risk on 11/23/2022 12:49:00 PM
From BofA:
On net, today's data pushed up our 4Q US GDP tracking from 1.4% q/q saar to 1.8% q/q saar and left our 3Q US GDP tracking unchanged at 3.0% q/q saar. [Nov 23rd estimate]From Goldman:
emphasis added
We boosted our Q4 GDP tracking estimate by 0.5pp to +1.5% (qoq ar). [Nov 23rd estimate]And from the Altanta Fed: GDPNow
The GDPNow model estimate for real GDP growth (seasonally adjusted annual rate) in the fourth quarter of 2022 is 4.3 percent on November 23, up from 4.2 percent on November 17. [Nov 23rd estimate]
New Home Sales Increased in October; Completed Inventory Increased
by Calculated Risk on 11/23/2022 10:39:00 AM
Today, in the Calculated Risk Real Estate Newsletter: New Home Sales Increased in October; Completed Inventory Increased
Brief excerpt:
The next graph shows the months of supply by stage of construction. “Months of supply” is inventory at each stage, divided by the sales rate.You can subscribe at https://calculatedrisk.substack.com/.
There are 1.2 months of completed supply (red line). This is getting close to the normal level.
The inventory of new homes under construction is at 5.7 months (blue line). This elevated level of homes under construction is due to supply chain constraints.
And a record 111 thousand homes have not been started - about 2.1 months of supply (grey line) - about double the normal level. Homebuilders are probably waiting to start some homes until they have a firmer grasp on prices and demand.
...
First, as I discussed two months ago, the Census Bureau overestimates sales, and underestimates inventory when cancellation rates are rising, see: New Home Sales and Cancellations: Net vs Gross Sales. So, take the headline sales number with a large grain of salt - the actual negative impact on the homebuilders is far greater than the headline number suggests!
...
There are a large number of homes under construction, and this suggests we will see a sharp increase in completed inventory over the next several months - and that will put pressure on new home prices.

New Home Sales Increase to 632,000 Annual Rate in October
by Calculated Risk on 11/23/2022 10:08:00 AM
The Census Bureau reports New Home Sales in October were at a seasonally adjusted annual rate (SAAR) of 632 thousand.
The previous two months were revised down.
Sales of new single‐family houses in October 2022 were at a seasonally adjusted annual rate of 632,000, according to estimates released jointly today by the U.S. Census Bureau and the Department of Housing and Urban Development. This is 7.5 percent above the revised September rate of 588,000, but is 5.8 percent below the October 2021 estimate of 671,000.
emphasis added
 Click on graph for larger image.
The first graph shows New Home Sales vs. recessions since 1963. The dashed line is the current sales rate.
New home sales are below pre-pandemic levels.
The second graph shows New Home Months of Supply.
 The months of supply decreased in October to 8.9 months from 9.4 months in September.
 The all-time record high was 12.1 months of supply in January 2009. The all-time record low was 3.5 months, most recently in October 2020.
This is well above the top of the normal range (about 4 to 6 months of supply is normal).
"The seasonally‐adjusted estimate of new houses for sale at the end of October was 470,000. This represents a supply of 8.9 months at the current sales rate."
 The last graph shows sales NSA (monthly sales, not seasonally adjusted annual rate).
In October 2022 (red column), 48 thousand new homes were sold (NSA). Last year, 51 thousand homes were sold in October.
The all-time high for October was 105 thousand in 2005, and the all-time low for October was 23 thousand in 2010.
This was above expectations, however sales in the two previous months were revised down. I'll have more later today.
Weekly Initial Unemployment Claims increase to 240,000
by Calculated Risk on 11/23/2022 08:35:00 AM
The DOL reported:
In the week ending November 19, the advance figure for seasonally adjusted initial claims was 240,000, an increase of 17,000 from the previous week's revised level. The previous week's level was revised up by 1,000 from 222,000 to 223,000. The 4-week moving average was 226,750, an increase of 5,500 from the previous week's revised average. The previous week's average was revised up by 250 from 221,000 to 221,250.The following graph shows the 4-week moving average of weekly claims since 1971.
emphasis added
Click on graph for larger image.The dashed line on the graph is the current 4-week average. The four-week average of weekly unemployment claims increased to 226,750.
The previous week was revised up.
Weekly claims were above the consensus forecast.
MBA: Mortgage Applications Increase in Latest Weekly Survey
by Calculated Risk on 11/23/2022 07:00:00 AM
From the MBA: Mortgage Applications Increase in Latest MBA Weekly Survey
Mortgage applications increased 2.2 percent from one week earlier, according to data from the Mortgage Bankers Association’s (MBA) Weekly Mortgage Applications Survey for the week ending November 18, 2022. Last week’s results include an adjustment for the observance of Veterans Day.
... The Refinance Index increased 2 percent from the previous week and was 86 percent lower than the same week one year ago. The seasonally adjusted Purchase Index increased 3 percent from one week earlier. The unadjusted Purchase Index increased 9 percent compared with the previous week and was 41 percent lower than the same week one year ago.
“The 30-year fixed-rate mortgage fell for the second week in a row to 6.67 percent and is now down almost 50 basis points from the recent peak of 7.16 percent one month ago,” said Joel Kan, MBA’s Vice President and Deputy Chief Economist. “The decrease in mortgage rates should improve the purchasing power of prospective homebuyers, who have been largely sidelined as mortgage rates have more than doubled in the past year. As a result of the drop in mortgage rates, both purchase and refinance applications picked up slightly last week. However, refinance activity is still more than 80 percent below last year’s pace.”
Added Kan, “With the decline in rates, the ARM share of applications also decreased to 8.8 percent of loans last week, down from the range of 10 and 12 percent during the past two months.”
...
The average contract interest rate for 30-year fixed-rate mortgages with conforming loan balances ($647,200 or less) decreased to 6.67 percent from 6.90 percent, with points increasing to 0.68 from 0.56 (including the origination fee) for 80 percent loan-to-value ratio (LTV) loans.
emphasis added
 Click on graph for larger image.
The first graph shows the refinance index since 1990.
With higher mortgage rates, the refinance index has declined sharply this year.
The refinance index is near the lowest level since the year 2000.
The second graph shows the MBA mortgage purchase index
 According to the MBA, purchase activity is down 41% year-over-year unadjusted.
The purchase index is 4% below the pandemic low and just up from the lowest level since 2015.
Note: Red is a four-week average (blue is weekly).
Note: Red is a four-week average (blue is weekly).
Tuesday, November 22, 2022
Wednesday: Unemployment Claims, Durable Goods, New Home Sales, FOMC Minutes
by Calculated Risk on 11/22/2022 08:50:00 PM
 Note: Mortgage rates are from MortgageNewsDaily.com and are for top tier scenarios.
Wednesday:
• At 7:00 AM ET, The Mortgage Bankers Association (MBA) will release the results for the mortgage purchase applications index.
• At 8:30 AM, The initial weekly unemployment claims report will be released. The consensus is for 225 thousand initial claims, up from 222 thousand last week.
• At 8:30 AM, Durable Goods Orders for October from the Census Bureau. The consensus is for a 0.4% increase in durable goods orders.
• At 10:00 AM, New Home Sales for October from the Census Bureau. The consensus is for 570 thousand SAAR, down from 603 thousand in September.
• At 2:00 PM, FOMC Minutes, Meeting of November 1-2, 2022
November Vehicle Sales Forecast: Down slightly from October; Up 11% Year-over-year
by Calculated Risk on 11/22/2022 02:58:00 PM
From WardsAuto: November U.S. Light-Vehicle Sales to Slow from Prior Month; Still Point to Stronger Q4 (pay content). Brief excerpt:
Although heavily laden with pickups, inventory will rise again in November, lifting the prospects that the year ends on a strong note by overcoming challenges including myriad economy-related headwinds, high prices, potential railroad labor strike and others.
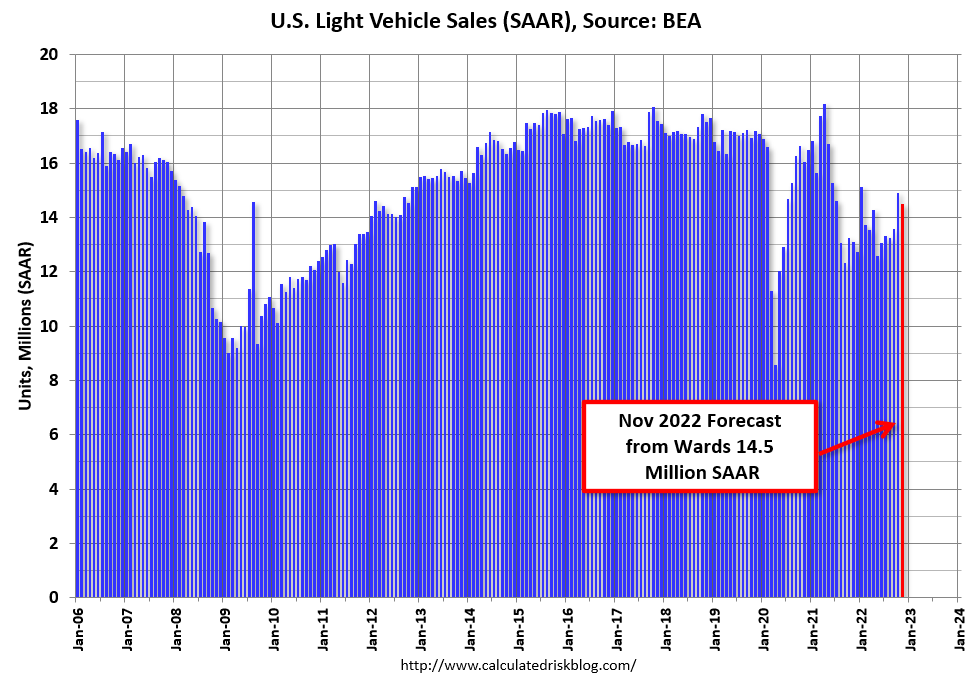 Click on graph for larger image.
This graph shows actual sales from the BEA (Blue), and Wards forecast for November (Red).
The Wards forecast of 14.5 million SAAR, would be down 3% from last month, but up 11% from a year ago (sales weakened in the second half of 2021, due to supply chain issues).
Vehicle sales are usually a transmission mechanism for Federal Open Market Committee (FOMC) policy, far behind housing. However, this time, vehicle sales have been suppressed by supply chain issues, and sales will probably not be significantly impacted by higher interest rates.
Black Knight: Mortgage Delinquency Rate Increased in October, Impacted by Hurricane
by Calculated Risk on 11/22/2022 12:43:00 PM
From Black Knight: Black Knight’s First Look: Prepayment Activity Hit Record Low in October as Rates Topped 7%; Mortgage Delinquencies Up 4.5% in First Signs of Hurricane Ian Impact
• Prepayments fell 16.5% to a single-month mortality (SMM) rate of 0.48%, well below the previous record of 0.55% and the lowest recorded since at least 2000 when Black Knight began reporting the metricAccording to Black Knight's First Look report, the percent of loans delinquent increased 4.5% in October compared to September and decreased 22% year-over-year.
• The national delinquency rate rose 4.5% in October to 2.91% – up 12 basis points since September – driven by a sharp 9.4% rise in 30-day delinquencies
• Florida led the jump in new early delinquencies (+19K) – with the state delinquency rate rising 53 basis points to 3.42% -- giving an initial indication of Hurricane Ian impact
• Loans 60 days past due ticked up 2.9% nationally, while those 90 or more days delinquent saw continued – if modest – improvement, inching down another 1.5% in October
• October’s 19.6K foreclosure starts represented a 7% increase that partly reversed September’s decline, but are still 55% below pre-pandemic levels
• Foreclosure starts were initiated on 4% of existing serious delinquencies in October, up slightly from September but still less than half the rate seen in the years leading up to the pandemic
• Active foreclosure inventory held steady as volumes have remained subdued in 2022 due to still historically low foreclosure start levels
emphasis added
Black Knight reported the U.S. mortgage delinquency rate (loans 30 or more days past due, but not in foreclosure) was 2.91% in October, down from 2.78% in September.
The percent of loans in the foreclosure process increased slightly in October at 0.35%, from 0.35% in September.
The number of delinquent properties, but not in foreclosure, is down 555,000 properties year-over-year, and the number of properties in the foreclosure process is up 48,000 properties year-over-year.
| Black Knight: Percent Loans Delinquent and in Foreclosure Process | ||||
|---|---|---|---|---|
| Oct 2022 | Sept 2022 | Oct 2021 | Oct 2020 | |
| Delinquent | 2.91% | 2.78% | 3.74% | 6.44% |
| In Foreclosure | 0.35% | 0.35% | 0.26% | 0.33% |
| Number of properties: | ||||
| Number of properties that are delinquent, but not in foreclosure: | 1,557,000 | 1,491,000 | 1,986,000 | 3,437,000 |
| Number of properties in foreclosure pre-sale inventory: | 186,000 | 185,000 | 138,000 | 178,000 |
| Total Properties | 1,743,000 | 1,677,000 | 2,125,000 | 3,616,000 |


