 RSS Feed
 by Calculated Risk on 11/21/2022 08:41:00 PM
Monday, November 21, 2022
Tuesday: Richmond Fed Mfg
 From Matthew Graham at Mortgage News Daily: Mortgage Rates Little-Changed to Start Holiday-Shortened Week
Mortgage rates made their biggest recent move (and their biggest single day move ever) 2 Thursday's ago after a key report showed inflation was lower than expected in October. There has been some jockeying for position among various mortgage lenders since then, but remarkably little change to the average 30yr fixed rate which is once again in the mid 6% range. ... [30 year fixed 6.64%]Tuesday:
emphasis added
• At 8:30 AM ET, Richmond Fed Survey of Manufacturing Activity for November.
MBA Survey: "Share of Mortgage Loans in Forbearance Increases Slightly to 0.70% in October"
by Calculated Risk on 11/21/2022 04:12:00 PM
Note: This is as of October 31st.
From the MBA: Share of Mortgage Loans in Forbearance Increases Slightly to 0.70% in October
The Mortgage Bankers Association’s (MBA) monthly Loan Monitoring Survey revealed that the total number of loans now in forbearance increased by 1 basis point from 0.69% of servicers’ portfolio volume in the prior month to 0.70% as of October 31, 2022. According to MBA’s estimate, 350,000 homeowners are in forbearance plans.
The share of Fannie Mae and Freddie Mac loans in forbearance increased 1 basis point to 0.31%. Ginnie Mae loans in forbearance increased 8 basis points to 1.41%, and the forbearance share for portfolio loans and private-label securities (PLS) declined 11 basis points to 1.03%.
“The overall share of loans in forbearance increased slightly in October, but it was a mixed bag by investor type. The forbearance rate for Ginnie Mae, Fannie Mae, and Freddie Mac loans increased, and there was a decline in portfolio and PLS loans in forbearance,” said Marina Walsh, CMB, MBA’s Vice President of Industry Analysis. “Several factors were behind the first monthly increase in forbearances in 29 months, including the effects of Hurricane Ian in the Southeast, the diminishing number of loans bought out of Ginnie Mae pools and placed in portfolio, and the fact that new forbearance requests have closely matched forbearance exits for the past three months.”
...
Added Walsh, “The overall share of loans that were current last month decreased 15 basis points to 95.70%, with 44 states reporting declines (not delinquent or in foreclosure). Florida, which was hit the hardest by Hurricane Ian, experienced a 49-basis-point drop in the share of loans that were current – the biggest decline of all states.”
emphasis added
 Click on graph for larger image.
This graph shows the percent of portfolio in forbearance by investor type over time.
The share of forbearance plans had been decreasing, although there was a slight increase in October. At the end of October, there were about 350,000 homeowners in forbearance plans.
Final Look at Local Housing Markets in October
by Calculated Risk on 11/21/2022 12:43:00 PM
Today, in the Calculated Risk Real Estate Newsletter: Final Look at Local Housing Markets in October
A brief excerpt:
The big story for October existing home sales was the sharp year-over-year (YoY) decline in sales. Another key story was that new listings were down further YoY in October as many potential sellers are locked into their current home (low mortgage rate). And active inventory increased sharply YoY.There is much more in the article. You can subscribe at https://calculatedrisk.substack.com/
This is the final look at local markets in October. I’m tracking about 35 local housing markets in the US. Some of the 35 markets are states, and some are metropolitan areas. I update these tables throughout each month as additional data is released.
Important: Closed sales in October were mostly for contracts signed in August and September. Rates increased to around 6% in September and that impacted closed sales in October. In October 30-year mortgage rates jumped to over 7%, and that will negatively impact closed sales in November and December.
...
And a table of October sales. In October, sales were down 28.6% YoY Not Seasonally Adjusted (NSA) for these markets. ... The NAR reported sales were down 29.5% NSA YoY in October.
Sales in some of the hottest markets are down around 40% YoY (all of California was down 37%), whereas in other markets, sales are only down in around 20% YoY.
...
More local data coming in December for activity in November! We should expect an even larger YoY sales decline in November and December due to the increase in mortgage rates in September and October.

Housing November 21st Weekly Update: Inventory Decreased Slightly Week-over-week
by Calculated Risk on 11/21/2022 08:57:00 AM
Active inventory decreased slightly. Here are the same week inventory changes for the last four years (usually inventory declines seasonally through the Winter):
2022: -3.0K (smaller than usual decrease in inventory)
2021: -8.9K
2020: -10.5K
2019: -14.7K
Altos reports inventory is down 0.5% week-over-week and down 1.5% from the peak on October 28th.
 Click on graph for larger image.
This inventory graph is courtesy of Altos Research.
 Click on graph for larger image.
This inventory graph is courtesy of Altos Research.
As of November 18th, inventory was at 569 thousand (7-day average), compared to 572 thousand the prior week.
Compared to the same week in 2021, inventory is up 47.7% from 385 thousand, and compared to the same week in 2020 inventory is up 10.6% from 514 thousand. However, compared to 3 years ago (2019), inventory is down 35.2% from 877 thousand.
Here are the inventory milestones I’ve been watching for with the Altos data:
1. The seasonal bottom (happened on March 4, 2022, for Altos) ✅
2. Inventory up year-over-year (happened on May 20, 2022, for Altos) ✅
3. Inventory up compared to 2020 (happened on October 7, 2022, for Altos) ✅
4. Inventory up compared to 2019 (currently down 35.2%).

1. The seasonal bottom (happened on March 4, 2022, for Altos) ✅
2. Inventory up year-over-year (happened on May 20, 2022, for Altos) ✅
3. Inventory up compared to 2020 (happened on October 7, 2022, for Altos) ✅
4. Inventory up compared to 2019 (currently down 35.2%).

Here is a graph of the inventory change vs 2021 (milestone 2 above), 2020 (milestone 3) and 2019 (milestone 4).
The blue line is the year-over-year data, the red line is compared to two years ago, and dashed purple is compared to 2019.
A key will be if inventory declines slower than usual during the winter months.
Mike Simonsen discusses this data regularly on Youtube.
Four High Frequency Indicators for the Economy
by Calculated Risk on 11/21/2022 08:32:00 AM
These indicators are mostly for travel and entertainment. It was interesting to watch these sectors recover as the pandemic impact subsided.
The TSA is providing daily travel numbers.
This data is as of November 20th.
 Click on graph for larger image.
This data shows the 7-day average of daily total traveler throughput from the TSA for 2019 (Light Blue), 2020 (Black), 2021 (Blue) and 2022 (Red).
The dashed line is the percent of 2019 for the seven-day average.
The 7-day average is 2.6% below the same week in 2019 (97.4% of 2019). (Dashed line)
Air travel - as a percent of 2019 - has picked up recently.
----- Movie Tickets: Box Office Mojo -----
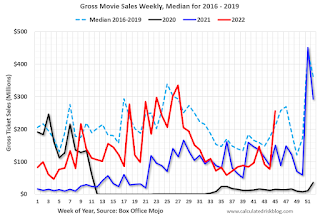 This data shows domestic box office for each week and the median for the years 2016 through 2019 (dashed light blue).
 This data shows domestic box office for each week and the median for the years 2016 through 2019 (dashed light blue).
 Black is 2020, Blue is 2021 and Red is 2022.
The data is from BoxOfficeMojo through November 17th.
Note that the data is usually noisy week-to-week and depends on when blockbusters are released.
Movie ticket sales were at $255 million last week - almost entirely due to Black Panther: Wakanda Forever - up about 21% from the median for the week.
Note that the data is usually noisy week-to-week and depends on when blockbusters are released.
Movie ticket sales were at $255 million last week - almost entirely due to Black Panther: Wakanda Forever - up about 21% from the median for the week.
 This graph shows the seasonal pattern for the hotel occupancy rate using the four-week average.
 The red line is for 2022, black is 2020, blue is the median, and dashed light blue is for 2021. Dashed purple is 2019 (STR is comparing to a strong year for hotels).
This data is through Nov 12th. The occupancy rate was up 0.9% compared to the same week in 2019.
The 4-week average of the occupancy rate is above the median rate for the previous 20 years (Blue) and close to 2019 levels.
Notes: Y-axis doesn't start at zero to better show the seasonal change.
Notes: Y-axis doesn't start at zero to better show the seasonal change.

This graph, based on weekly data from the U.S. Energy Information Administration (EIA), shows gasoline supplied compared to the same week of 2019.
Blue is for 2020. Purple is for 2021, and Red is for 2022.
As of November 11th, gasoline supplied was down 6.2% compared to the same week in 2019.
Recently gasoline supplied has been running below 2019 and 2021 levels - and sometimes below 2020.
Sunday, November 20, 2022
Sunday Night Futures
by Calculated Risk on 11/20/2022 07:02:00 PM
Weekend:
• Schedule for Week of November 20, 2022
Monday:
• AT 8:30 AM ET, Chicago Fed National Activity Index for October. This is a composite index of other data.
From CNBC: Pre-Market Data and Bloomberg futures S&P 500 are down 5 and DOW futures are down 40 (fair value).
Oil prices were down over the last week with WTI futures at $80.08 per barrel and Brent at $87.62 per barrel. A year ago, WTI was at $77, and Brent was at $81 - so WTI oil prices are up 4% year-over-year.
Here is a graph from Gasbuddy.com for nationwide gasoline prices. Nationally prices are at $3.67 per gallon. A year ago, prices were at $3.41 per gallon, so gasoline prices are up $0.26 per gallon year-over-year.
Hotels: Occupancy Rate Up 0.9% Compared to Same Week in 2019
by Calculated Risk on 11/20/2022 08:15:00 AM
U.S. hotel performance came in higher than the previous week and showed improved comparisons to 2019, according to STR‘s latest data through Nov. 12.The following graph shows the seasonal pattern for the hotel occupancy rate using the four-week average.
Nov. 6-12, 2022 (percentage change from comparable week in 2019*):
• Occupancy: 64.6% (+0.9%)
• Average daily rate (ADR): US$148.43 (+17.1%)
• Revenue per available room (RevPAR): US$95.89 (+18.2%)
*Due to the pandemic impact, STR is measuring recovery against comparable time periods from 2019.
emphasis added
Click on graph for larger image.The red line is for 2022, black is 2020, blue is the median, and dashed light blue is for 2021. Dashed purple is 2019 (STR is comparing to a strong year for hotels).
The 4-week average of the occupancy rate is above the median rate for the previous 20 years (Blue) and close to 2019 levels.
Note: Y-axis doesn't start at zero to better show the seasonal change.
The 4-week average of the occupancy rate will decline into the Winter.
Saturday, November 19, 2022
Real Estate Newsletter Articles this Week: Record Number of Housing Units Under Construction
by Calculated Risk on 11/19/2022 02:11:00 PM
At the Calculated Risk Real Estate Newsletter this week:
• October Housing Starts: Record Number of Housing Units Under Construction
• NAR: Existing-Home Sales Decreased to 4.43 million SAAR in October
• 3rd Look at Local Housing Markets in October; California Sales off 37% YoY, Prices Fall; Early Read on October Sales
• Lawler: Are US Rents Falling?
• 2nd Look at Local Housing Markets in October
This is usually published 4 to 6 times a week and provides more in-depth analysis of the housing market.
You can subscribe at https://calculatedrisk.substack.com/
Most content is available for free (and no Ads), but please subscribe!
Schedule for Week of November 20, 2022
by Calculated Risk on 11/19/2022 08:11:00 AM
The key report this week is October New Home sales.
For manufacturing, the Richmond Fed manufacturing survey will be released this week.
8:30 AM ET: Chicago Fed National Activity Index for October. This is a composite index of other data.
10:00 AM: Richmond Fed Survey of Manufacturing Activity for November.
7:00 AM ET: The Mortgage Bankers Association (MBA) will release the results for the mortgage purchase applications index.
8:30 AM: The initial weekly unemployment claims report will be released. The consensus is for 225 thousand initial claims, up from 222 thousand last week.
8:30 AM: Durable Goods Orders for October from the Census Bureau. The consensus is for a 0.4% increase in durable goods orders.
 10:00 AM: New Home Sales for October from the Census Bureau.
 This graph shows New Home Sales since 1963. The dashed line is the sales rate for last month.
The consensus is for 570 thousand SAAR, down from 603 thousand in September.
2:00 PM: FOMC Minutes, Meeting of November 1-2, 2022
All US markets will be closed in observance of the Thanksgiving Day Holiday.
The NYSE and the NASDAQ will close early at 1:00 PM ET.
Friday, November 18, 2022
COVID Nov 18, 2022: Update on Cases, Hospitalizations and Deaths
by Calculated Risk on 11/18/2022 08:27:00 PM
NOTE: COVID stats are updated on Fridays.
On COVID (focus on hospitalizations and deaths). Data has switched to weekly.
Weekly deaths bottomed in July 2021 at 1,666.
| COVID Metrics | ||||
|---|---|---|---|---|
| Now | Week Ago | Goal | ||
| New Cases per Week2 | 280,711 | 289,884 | ≤35,0001 | |
| Hospitalized2 | 21,275 | 21,722 | ≤3,0001 | |
| Deaths per Week2 | 2,222 | 2,347 | ≤3501 | |
| 1my goals to stop weekly posts, 2Weekly for Cases, Currently Hospitalized, and Deaths 🚩 Increasing number weekly for Cases, Hospitalized, and Deaths ✅ Goal met. | ||||
 Click on graph for larger image.
This graph shows the weekly (columns) number of deaths reported.


