 RSS Feed
 by Calculated Risk on 10/05/2022 09:01:00 PM
Wednesday, October 05, 2022
Thursday: Unemployment Claims
 Thursday:
• At 8:30 AM ET, The initial weekly unemployment claims report will be released. The consensus is for an increase to 203 thousand from 193 thousand last week.
Reis: Office Vacancy Rate Unchanged in Q3, Mall Vacancy Rate Unchanged
by Calculated Risk on 10/05/2022 03:44:00 PM
From Moody’s Analytics Senior Economist Lu Chen: Office continues its bumpy ride, and Retail remains flat
Office vacancy has been persistently stuck at over 18% since early 2021, a consequence of excess inventories and strains on companies’ expansion plans. Net absorption rose in June and July, in line with the return to office sentiment, but that trend was short-lived as economic uncertainties pressured the sector’s fundamentals. The 3rd quarter ended with an increase in office demand, but the 1.75 million square feet (sqft) total net absorption was less than a third of the total construction delivery of around 6 million sqft. Office vacancy moved slightly upwards last quarter, but due to rounding remained at an elevated 18.4%, near its pandemic peak. Asking rent exceeded $35/sqft ($35.04), which is equivalent of 0.4% growth compared to last quarter. Effective rent kept pace, but that’s only half its rate in Q2.
emphasis added
Reis reported the office vacancy rate was at 18.4% in Q3 2022, unchanged from 18.4% in Q2, and up from 18.2% in Q3 2021.
Q2 2021 at 18.5% was the highest vacancy rate for offices since the early '90s (following the S&L crisis)
NOTE: This says nothing about how many people are in the offices (related to the increase in work-from-home), just whether or not the office space is leased.
 Click on graph for larger image.
This graph shows the office vacancy rate starting in 1980 (prior to 1999 the data is annual).
The office vacancy rate was elevated prior to the pandemic and moved up during the pandemic.
Reis also reported that office effective rents increased 0.4% in Q3; rents are about at the same level as before the pandemic.
And from Reis on Retail:
Our data shows the national vacancy for neighborhood and community shopping center has stayed flat at 10.3% since a year ago, while asking/effective rent kept virtually unchanged in the 3rd quarter. Trend data on regional and super regional malls tells a similar story. Vacancy ticked up 10 basis-point to 11.1% and effective rent was up 0.1% this quarter. Despite some signs of stabilization, regional mall properties continue to be the most at-risk retail subtype according to our commercial mortgage delinquency data, and they are driving overall delinquency behavior among retail assets.
Reis reported that the vacancy rate for regional malls was 11.1% in Q3 2022, up from 11.0% in Q1 2021, and down from 11.3% in Q3 2021. The regional mall vacancy rate peaked at 11.5% in Q2 2021.
For Neighborhood and Community malls (strip malls), the vacancy rate was 10.3% in Q3, unchanged from 10.3% in Q2, and down from 10.4% in Q3 2021. For strip malls, the vacancy rate peaked during the pandemic at 10.6% in both Q1 and Q2 2021.
 This graph shows the strip mall vacancy rate starting in 1980 (prior to 2000 the data is annual). The regional mall data starts in 2000. Back in the '80s, there was overbuilding in the mall sector even as the vacancy rate was rising. This was due to the very loose commercial lending that led to the S&L crisis.
 In the mid-'00s, mall investment picked up as mall builders followed the "roof tops" of the residential boom (more loose lending). This led to the vacancy rate moving higher even before the recession started. Then there was a sharp increase in the vacancy rate during the recession and financial crisis.
In the last several years, even prior to the pandemic, the regional mall vacancy rates increased significantly from an already elevated level.
Effective rents have been mostly unchanged for regional malls over the last 4+ years, and flat for strip malls for 3+ years.
All vacancy data courtesy of Moody’s Analytics Reis
Apartments: Net Absorption Very Low in Q3, New Construction Deliveries Even Lower
by Calculated Risk on 10/05/2022 11:54:00 AM
Today, in the Calculated Risk Real Estate Newsletter: Apartments: Net Absorption Very Low in Q3, New Construction Deliveries Even Lower
A brief excerpt:
Moody’s Analytics also reported the effective rents were up 1.7% in Q3 from Q2, and up 10.2% year-over-year (YoY). This is a sharp slowdown from Q2 when rents were up 16.9% YoY.There is more in the article. You can subscribe at https://calculatedrisk.substack.com/
Click on graph for larger image.
Last week, I posted a graph of the year-over-year change for various measures of rent. The Zillow measure is up 12.3% YoY in August, down from 13.8% YoY in July. This is down from a peak of 17.2% YoY in February. The ApartmentList measure is up 7.5% YoY as of September, down from 9.8% in August. This is down from the peak of 18.0% YoY last November.
Reis’ survey (dashed red) is quarterly and shows a similar slowdown in effective rents.
...
The bottom line is apartment demand was soft in Q3, household formation has slowed sharply, and there are a large number of apartments in the pipeline. We should see completions above net absorption soon, and the completion of all these units under construction should help with rent pressure.

ISM® Services Index Decreased to 56.7% in September
by Calculated Risk on 10/05/2022 10:04:00 AM
(Posted with permission). The ISM® Services index was at 56.7%, down from 56.9% last month. The employment index increased to 53.0%, from 50.2%. Note: Above 50 indicates expansion, below 50 in contraction.
From the Institute for Supply Management: Services PMI® at 56.7% September 2022 Services ISM® Report On Business®
Economic activity in the services sector grew in September for the 28th month in a row — with the Services PMI® registering 56.7 percent — say the nation’s purchasing and supply executives in the latest Services ISM® Report On Business®.This was above expectations.
The report was issued today by Anthony Nieves, CPSM, C.P.M., A.P.P., CFPM, Chair of the Institute for Supply Management® (ISM®) Services Business Survey Committee: “In September, the Services PMI® registered 56.7 percent, 0.2 percentage point lower than August’s reading of 56.9 percent. The Business Activity Index registered 59.1 percent, a decrease of 1.8 percentage points compared to the reading of 60.9 percent in August. The New Orders Index figure of 60.6 percent is 1.2 percentage points lower than the August reading of 61.8 percent.
emphasis added
Trade Deficit decreased to $67.4 Billion in August
by Calculated Risk on 10/05/2022 08:38:00 AM
From the Department of Commerce reported:
The U.S. Census Bureau and the U.S. Bureau of Economic Analysis announced today that the goods and services deficit was $67.4 billion in August, down $3.1 billion from $70.5 billion in July, revised.
August exports were $258.9 billion, $0.7 billion less than July exports. August imports were $326.3 billion, $3.7 billion less than July imports.
emphasis added
 Click on graph for larger image.
Exports increased and imports decreased in August.
Exports are up 20% year-over-year; imports are up 14% year-over-year.
Both imports and exports decreased sharply due to COVID-19 and have now bounced back.
The second graph shows the U.S. trade deficit, with and without petroleum.
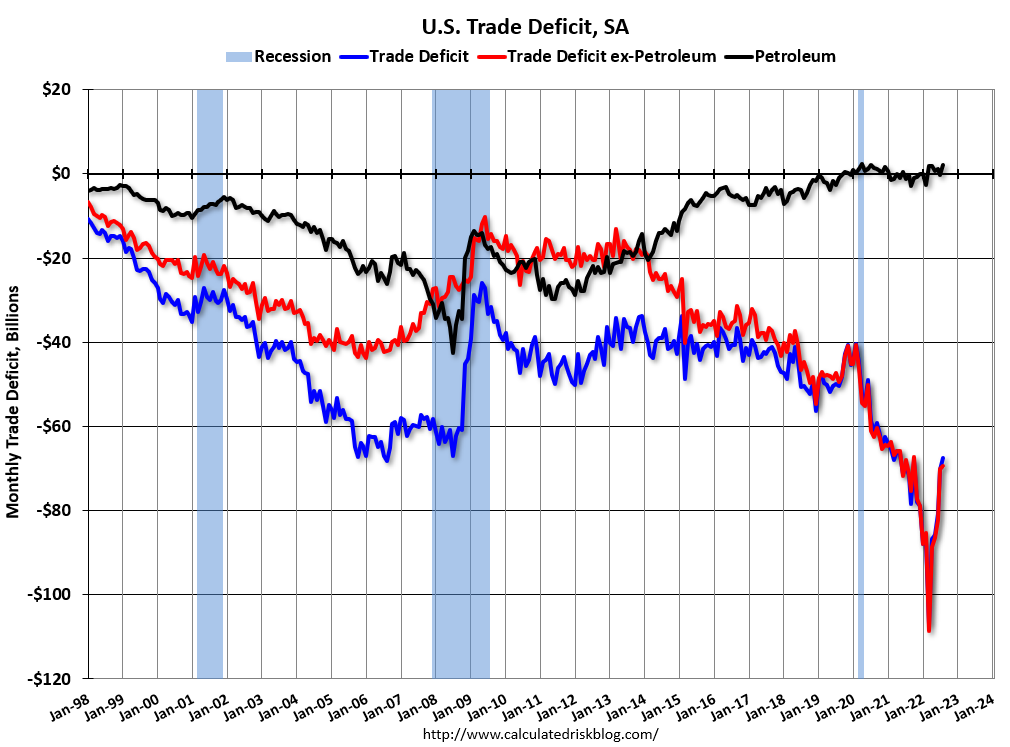 The blue line is the total deficit, and the black line is the petroleum deficit, and the red line is the trade deficit ex-petroleum products.
Note that net, imports and exports of petroleum products are close to zero.
The trade deficit with China increased to $37.4 billion in August, from $21.7 billion a year ago.
The trade deficit was slightly lower than the consensus forecast.
ADP: Private Employment Increased 208,000 in September
by Calculated Risk on 10/05/2022 08:20:00 AM
Note: This is the second release of a new methodology. Historical data based on the new methodology is available.
From ADP: ADP National Employment Report: Private Sector Employment Increased by
208,000 Jobs in September; Annual Pay was Up 7.8%
Private sector employment increased by 208,000 jobs in September and annual pay was up 7.8% year-over-year, according to the September ADP® National Employment ReportTM produced by the ADP Research Institute® in collaboration with the Stanford Digital Economy Lab (“Stanford Lab”).This was close to the consensus forecast of 205,000. The BLS report will be released Friday, and the consensus is for 250 thousand non-farm payroll jobs added in September.
The jobs report and pay insights use ADP’s fine-grained anonymized and aggregated payroll data of over 25 million U.S. employees to provide a representative picture of the labor market. The report details the current month’s total private employment change, and weekly job data from the previous month. ADP’s pay measure uniquely captures the earnings of a cohort of almost 10 million employees over a 12-month period.
“We are continuing to see steady job gains,” said Nela Richardson, chief economist, ADP. “While job stayers saw a pay increase, annual pay growth for job changers in September is down from August.”
emphasis added
MBA: Mortgage Applications Decrease in Latest Weekly Survey; Purchase Activity Below Pandemic Low
by Calculated Risk on 10/05/2022 07:00:00 AM
From the MBA: Mortgage Applications Decrease in Latest MBA Weekly Survey
Mortgage applications decreased 14.2 percent from one week earlier, according to data from the Mortgage Bankers Association’s (MBA) Weekly Mortgage Applications Survey for the week ending September 30, 2022.
... The Refinance Index decreased 18 percent from the previous week and was 86 percent lower than the same week one year ago. The seasonally adjusted Purchase Index decreased 13 percent from one week earlier. The unadjusted Purchase Index decreased 13 percent compared with the previous week and was 37 percent lower than the same week one year ago.
“Mortgage rates continued to climb last week, causing another pullback in overall application activity, which dropped to its slowest pace since 1997. The 30-year fixed rate hit 6.75 percent last week – the highest rate since 2006,” said Joel Kan, MBA’s Associate Vice President of Economic and Industry Forecasting. “The current rate has more than doubled over the past year and has increased 130 basis points in the past seven weeks alone. The steep increase in rates continued to halt refinance activity and is also impacting purchase applications, which have fallen 37 percent behind last year’s pace. Additionally, the spreads between the conforming rate compared to jumbo loans widened again, and we saw the ARM share rise further to almost 12 percent of applications.”
Added Kan, “There was also an impact from Hurricane Ian’s arrival in Florida last week, which prompted widespread closings and evacuations. Applications in Florida fell 31 percent, compared to 14 percent overall, on a non-seasonally adjusted basis.”
...
The average contract interest rate for 30-year fixed-rate mortgages with conforming loan balances ($647,200 or less) increased to 6.75 percent from 6.52 percent, with points decreasing to 0.95 from 1.15 (including the origination fee) for 80 percent loan-to-value ratio (LTV) loans.
emphasis added
 Click on graph for larger image.
The first graph shows the refinance index since 1990.
With higher mortgage rates, the refinance index has declined sharply this year.
The refinance index is at the lowest level since the year 2000.
The second graph shows the MBA mortgage purchase index
 According to the MBA, purchase activity is down 37% year-over-year unadjusted.
The purchase index is 5% below the pandemic low and at the lowest level since 2015.
Note: Red is a four-week average (blue is weekly).
Note: Red is a four-week average (blue is weekly).
Tuesday, October 04, 2022
Wednesday: ADP Employment, Trade Deficit, ISM Services
by Calculated Risk on 10/04/2022 08:59:00 PM
 Wednesday:
• At 7:00 AM ET: The Mortgage Bankers Association (MBA) will release the results for the mortgage purchase applications index.
• At 8:15 AM: The ADP Employment Report for September. This report is for private payrolls only (no government). The consensus is for 205,000 jobs added, up from 132,000 in August.
• At 8:30 AM: Trade Balance report for August from the Census Bureau. The consensus is for the deficit to be $68.0 billion in August, from $70.7 billion in July.
• At 10:00 AM: the ISM Services Index for September.
Heavy Truck Sales Up 20% Year-over-year
by Calculated Risk on 10/04/2022 03:37:00 PM
The BEA released their estimate of vehicle sales for September this morning.
This graph shows heavy truck sales since 1967 using data from the BEA. The dashed line is the September 2022 seasonally adjusted annual sales rate (SAAR).
Heavy truck sales really collapsed during the great recession, falling to a low of 180 thousand SAAR in May 2009. Then heavy truck sales increased to a new all-time high of 570 thousand SAAR in April 2019.
 Click on graph for larger image.
Note: "Heavy trucks - trucks more than 14,000 pounds gross vehicle weight."
Heavy truck sales declined sharply at the beginning of the pandemic, falling to a low of 308 thousand SAAR in May 2020.
Heavy truck sales were at 504 thousand SAAR in September, unchanged from 504 thousand in August, and up from 420 thousand SAAR in September 2021.
Usually, heavy truck sales decline sharply prior to a recession. Sales were solid in September.
House Prices: 7 Years in Purgatory
by Calculated Risk on 10/04/2022 01:08:00 PM
Today, in the Calculated Risk Real Estate Newsletter: House Prices: 7 Years in Purgatory
A brief excerpt:
However, even in normal times, house prices are not sticky downwards in real terms as this graph shows.There is much more in the article. You can subscribe at https://calculatedrisk.substack.com/
In the July Case-Shiller report, real prices were only up 5.4% year-over-year (YoY) and will likely be down YoY in real terms later this year.
However, we are already seeing nominal house price declines on a national basis. The Black Knight index (median price of a repeat sales index) was off almost 2% in August, and the CoreLogic repeat sales index for August (a three-month weighted average and not seasonally adjusted, NSA) was off close to 1% in August. And my estimate is the nominal Case-Shiller national index will be off almost 1% in August compared to the peak in June.


