 RSS Feed
 by Calculated Risk on 10/03/2022 10:05:00 AM
Monday, October 03, 2022
ISM® Manufacturing index Declined to 50.9% in September
(Posted with permission). The ISM manufacturing index indicated expansion. The PMI® was at 50.9% in September, down from 52.8% in August. The employment index was at 48.7%, down from 54.2% last month, and the new orders index was at 47.1%, down from 51.3%.
From ISM: Manufacturing PMI® at 50.9% September 2022 Manufacturing ISM® Report On Business®
Economic activity in the manufacturing sector grew in September, with the overall economy achieving a 28th consecutive month of growth, say the nation's supply executives in the latest Manufacturing ISM® Report On Business®.This suggests manufacturing expanded at a slower pace in September than in August. This was below the consensus forecast.
The report was issued today by Timothy R. Fiore, CPSM, C.P.M., Chair of the Institute for Supply Management® (ISM®) Manufacturing Business Survey Committee:
“The September Manufacturing PMI® registered 50.9 percent, 1.9 percentage points lower than the 52.8 percent recorded in August. This figure indicates expansion in the overall economy for the 28th month in a row after contraction in April and May 2020. The Manufacturing PMI® figure is the lowest since May 2020, when it registered 43.5 percent. The New Orders Index returned to contraction territory at 47.1 percent, 4.2 percentage points lower than the 51.3 percent recorded in August. The Production Index reading of 50.6 percent is a 0.2-percentage point increase compared to August’s figure of 50.4 percent. The Prices Index registered 51.7 percent, down 0.8 percentage point compared to the August figure of 52.5 percent. This is the index’s lowest reading since June 2020 (51.3 percent). The Backlog of Orders Index registered 50.9 percent, 2.1 percentage points lower than the August reading of 53 percent. After a single month of expansion, the Employment Index contracted at 48.7 percent, 5.5 percentage points lower than the 54.2 percent recorded in August. The Supplier Deliveries Index reading of 52.4 percent is 2.7 percentage points lower than the August figure of 55.1 percent. This is the index’s lowest reading since before the coronavirus pandemic (52.2 percent in December 2019). The Inventories Index registered 55.5 percent, 2.4 percentage points higher than the August reading of 53.1 percent. The New Export Orders Index contracted at 47.8 percent, down 1.6 percentage points compared to August’s figure of 49.4 percent. This is the index’s lowest reading since June 2020, when it registered 47.6 percent. The Imports Index remained in expansion territory at 52.6 percent, 0.1 percentage point above the August reading of 52.5 percent.”
emphasis added
Housing October 3rd Update: Inventory Increased 0.8% Last Week; Hits New Peak for 2022
by Calculated Risk on 10/03/2022 08:49:00 AM
Active inventory increased for the 3rd consecutive week, increasing 0.8% last week, and hitting a new peak for the year. Here are the same week inventory changes for the last four years (usually inventory is declining at this time of year):
2022: +4.3K
2021: -4.6K
2020: -4.9K
2019: -7.7K
Inventory bottomed seasonally at the beginning of March 2022 and is now up 133% since then. Altos reports inventory is up 31.1% year-over-year.
 Click on graph for larger image.
This inventory graph is courtesy of Altos Research.
 Click on graph for larger image.
This inventory graph is courtesy of Altos Research.
As of September 30th, inventory was at 561 thousand (7-day average), compared to 557 thousand the prior week.
Compared to the same week in 2021, inventory is up 31.1% from 428 thousand, and compared to the same week in 2020 inventory is down only 0.3% from 563 thousand. Compared to 3 years ago, inventory is down 41.3% from 963 thousand.
Here are the inventory milestones I’m watching for with the Altos data:
1. The seasonal bottom (happened on March 4th for Altos) ✅
2. Inventory up year-over-year (happened on May 13th for Altos) ✅
3. Inventory up compared to two years ago (currently down 0.3% according to Altos)
4. Inventory up compared to 2019 (currently down 41.3%).

1. The seasonal bottom (happened on March 4th for Altos) ✅
2. Inventory up year-over-year (happened on May 13th for Altos) ✅
3. Inventory up compared to two years ago (currently down 0.3% according to Altos)
4. Inventory up compared to 2019 (currently down 41.3%).

Here is a graph of the inventory change vs 2021, 2020 (milestone 3 above) and 2019 (milestone 4).
The blue line is the year-over-year data, the red line is compared to two years ago, and dashed purple is compared to 2019.
Two years ago (in 2020) inventory was declining all year. Based on the recent changes in inventory, my current estimate is inventory will be up next week compared to 2020!
A key will be if inventory increases in the Fall this year. Inventory was up in September.
Mike Simonsen discusses this data regularly on Youtube.
Four High Frequency Indicators for the Economy
by Calculated Risk on 10/03/2022 08:33:00 AM
These indicators are mostly for travel and entertainment. It is interesting to watch these sectors recover as the pandemic subsides.
The TSA is providing daily travel numbers.
This data is as of October 2nd.
 Click on graph for larger image.
This data shows the 7-day average of daily total traveler throughput from the TSA for 2019 (Light Blue), 2020 (Black), 2021 (Blue) and 2022 (Red).
The dashed line is the percent of 2019 for the seven-day average.
The 7-day average is down 10.9% from the same day in 2019 (89.1% of 2019). (Dashed line)
Air travel - as a percent of 2019 - had picked up towards the end of Summer, but is now, off about 10% from 2019 like earlier in the year.
 This data shows domestic box office for each week and the median for the years 2016 through 2019 (dashed light blue).
 Black is 2020, Blue is 2021 and Red is 2022.
The data is from BoxOfficeMojo through September 29th.
Note that the data is usually noisy week-to-week and depends on when blockbusters are released.
Movie ticket sales were at $83 million last week, down about 41% from the median for the week.
Note that the data is usually noisy week-to-week and depends on when blockbusters are released.
Movie ticket sales were at $83 million last week, down about 41% from the median for the week.
 This graph shows the seasonal pattern for the hotel occupancy rate using the four-week average.
 The red line is for 2022, black is 2020, blue is the median, and dashed light blue is for 2021. Dashed purple is 2019 (STR is comparing to a strong year for hotels).
This data is through Sept 24th. The occupancy rate was down 1.5% compared to the same week in 2019.
The 4-week average of the occupancy rate is above the median rate for the previous 20 years (Blue).
Notes: Y-axis doesn't start at zero to better show the seasonal change.
Notes: Y-axis doesn't start at zero to better show the seasonal change.

This graph, based on weekly data from the U.S. Energy Information Administration (EIA), shows gasoline supplied compared to the same week of 2019.
Blue is for 2020. Purple is for 2021, and Red is for 2022.
As of September 23rd, gasoline supplied was down 5.6% compared to the same week in 2019.
Recently gasoline supplied has been running below 2019 and 2021 levels - and sometimes below 2020.
Sunday, October 02, 2022
Monday: ISM Mfg, Construction Spending
by Calculated Risk on 10/02/2022 07:42:00 PM
Weekend:
• Schedule for Week of October 2, 2022
Monday:
• At 10:00 AM ET, ISM Manufacturing Index for September. The consensus is for a reading of 52.2, down from 52.8 in August.
• Also, at 10:00 AM, Construction Spending for August. The consensus is for a 0.3% decrease.
From CNBC: Pre-Market Data and Bloomberg futures S&P 500 are down 1 and DOW futures are up 42 (fair value).
Oil prices were up over the last week with WTI futures at $79.49 per barrel and Brent at $85.14 per barrel. A year ago, WTI was at $76, and Brent was at $79 - so WTI oil prices are up 5% year-over-year.
Here is a graph from Gasbuddy.com for nationwide gasoline prices. Nationally prices are at $3.76 per gallon. A year ago, prices were at $3.18 per gallon, so gasoline prices are up $0.58 per gallon year-over-year. NOTE: Gasoline prices in Los Angeles have spiked to near record $6.28 per gallon due to refinery issues.
Update: Framing Lumber Prices Close to Pre-Pandemic Levels
by Calculated Risk on 10/02/2022 12:04:00 PM
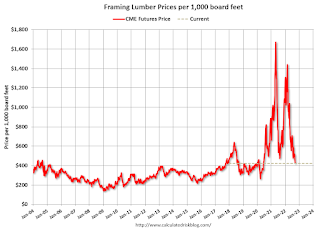
Here is another monthly update on framing lumber prices.
This graph shows CME random length framing futures through September 30th.
Lumber was at $425 per 1000 board feet on Friday.
This is down from the peak of $1,733, and down 34% from $643 a year ago.
Prices are close to the pre-pandemic levels of around $400.
 Click on graph for larger image.
It is unlikely we will see a runup in prices as happened at the end of last year due to the housing slowdown.
Prices are close to the pre-pandemic levels of around $400.
 Click on graph for larger image.
There is somewhat of a seasonal demand for lumber, and lumber prices usually peak in April or May, although peaked much earlier this year.
It is unlikely we will see a runup in prices as happened at the end of last year due to the housing slowdown.
Saturday, October 01, 2022
Real Estate Newsletter Articles this Week
by Calculated Risk on 10/01/2022 02:11:00 PM
At the Calculated Risk Real Estate Newsletter this week:
• Goldman Sees US House Prices Falling 5% to 10%
• Case-Shiller: National House Price Index "Continued its Deceleration" to 15.8% year-over-year increase in July
• Inflation Adjusted House Prices Declined Further in July
• New Home Sales Increased in August; Completed Inventory Increased
• Pace of Rent Increases Continues to Slow
• New Home Sales and Cancellations: Net vs Gross Sales
This is usually published 4 to 6 times a week and provides more in-depth analysis of the housing market.
You can subscribe at https://calculatedrisk.substack.com/
Most content is available for free (and no Ads), but please subscribe!
Schedule for Week of October 2, 2022
by Calculated Risk on 10/01/2022 08:11:00 AM
The key report this week is the September employment report on Friday.
Other key indicators include the September ISM Manufacturing and Services indices, September auto sales and the August trade deficit.
10:00 AM: ISM Manufacturing Index for September. The consensus is for a reading of 52.2, down from 52.8 in August.
10:00 AM: Construction Spending for August. The consensus is for a 0.3% decrease.
8:00 AM ET: Corelogic House Price index for August.
 10:00 AM: Job Openings and Labor Turnover Survey for August from the BLS.
 This graph shows job openings (black line), hires (purple), Layoff, Discharges and other (red column), and Quits (light blue column) from the JOLTS.
Jobs openings increased in July to 11.239 million from 11.040 million in June.
The number of job openings (yellow) were up 4% year-over-year. Quits were up 2% year-over-year.
 All day: Light vehicle sales for September.
The consensus is for sales of 13.5 million SAAR, up from 13.2 million SAAR in August (Seasonally Adjusted Annual Rate).
This graph shows light vehicle sales since the BEA started keeping data in 1967. The dashed line is the current sales rate.
7:00 AM ET: The Mortgage Bankers Association (MBA) will release the results for the mortgage purchase applications index.
8:15 AM: The ADP Employment Report for September. This report is for private payrolls only (no government). The consensus is for 205,000 jobs added, up from 132,000 in August.
 8:30 AM: Trade Balance report for August from the Census Bureau. The consensus is for the deficit to be $68.0 billion in August, from $70.7 billion in July.
This graph shows the U.S. trade deficit, with and without petroleum, through the most recent report. The blue line is the total deficit, and the black line is the petroleum deficit, and the red line is the trade deficit ex-petroleum products.
10:00 AM: the ISM Services Index for September.
8:30 AM: The initial weekly unemployment claims report will be released. The consensus is for an increase to 203 thousand from 193 thousand last week.
 8:30 AM: Employment Report for September. The consensus is for 250,000 jobs added, and for the unemployment rate to be unchanged at 3.7%.
There were 315,000 jobs added in August, and the unemployment rate was at 3.7%.
This graph shows the job losses from the start of the employment recession, in percentage terms.
The current employment recession was by far the worst recession since WWII in percentage terms. However, 30 months after the onset of the current employment recession, all of the jobs have returned.
Friday, September 30, 2022
COVID Sept 30, 2022, Update on Cases, Hospitalizations and Deaths
by Calculated Risk on 9/30/2022 09:14:00 PM
NOTE: Starting next week, COVID stats will be updated only on Fridays.
On COVID (focus on hospitalizations and deaths):
| COVID Metrics | ||||
|---|---|---|---|---|
| Now | Week Ago | Goal | ||
| New Cases per Day2 | 45,725 | 54,205 | ≤5,0001 | |
| Hospitalized2 | 23,052 | 25,159 | ≤3,0001 | |
| Deaths per Day2 | 325 | 376 | ≤501 | |
| 1my goals to stop daily posts, 27-day average for Cases, Currently Hospitalized, and Deaths 🚩 Increasing 7-day average week-over-week for Cases, Hospitalized, and Deaths ✅ Goal met. | ||||
 Click on graph for larger image.
This graph shows the daily (columns) and 7-day average (line) of deaths reported.
NOTE: Cases have declined by more than half, and deaths lag cases - so we might see average daily deaths in the 200s soon (good news, but still too high).
Average daily deaths bottomed in July 2021 at 214 per day.
Fannie Mae: Mortgage Serious Delinquency Rate Decreased in August
by Calculated Risk on 9/30/2022 04:11:00 PM
Fannie Mae reported that the Single-Family Serious Delinquency decreased to 0.72% in August from 0.76% in July. The serious delinquency rate is down from 1.79% in August 2021. This is almost back to pre-pandemic levels.
These are mortgage loans that are "three monthly payments or more past due or in foreclosure".
The Fannie Mae serious delinquency rate peaked in February 2010 at 5.59% following the housing bubble and peaked at 3.32% in August 2020 during the pandemic.
 Click on graph for larger image
By vintage, for loans made in 2004 or earlier (1% of portfolio), 2.48% are seriously delinquent (down from 2.60% in July).
For loans made in 2005 through 2008 (1% of portfolio), 3.95% are seriously delinquent (down from 4.11%),
For recent loans, originated in 2009 through 2021 (98% of portfolio), 0.57% are seriously delinquent (down from 0.60%). So, Fannie is still working through a few poor performing loans from the bubble years.
Mortgages in forbearance were counted as delinquent in this monthly report, but they were not reported to the credit bureaus.
Freddie Mac reported earlier.
Mortgages in forbearance were counted as delinquent in this monthly report, but they were not reported to the credit bureaus.
Freddie Mac reported earlier.
Goldman Sees US House Prices Falling 5% to 10%
by Calculated Risk on 9/30/2022 01:47:00 PM
Today, in the Calculated Risk Real Estate Newsletter: Goldman See US House Prices Falling 5% to 10%
Excerpt:
The recent weakness in the housing market, combined with mortgage rates close to 7%, have led to some downwards revisions to house price forecasts. For example, from Goldman Sachs economists today:Our G10 home price model suggests sizable nominal home prices declines from the peak of around 15% in Canada, 5-10% in the US, and under 5% in the UK. … We view the risks to these estimates as tilted to the downsideThis is a significant downgrade from Goldman’s “stall” forecast from just a few weeks ago. ...
emphasis added
It now appears house prices are falling even though inventory levels are still historically fairly low (by measures of active inventory or months of supply). ... Here is a look at existing home months-of-supply (inverted, from the NAR) vs. the seasonally adjusted month-to-month price change in the Case-Shiller National Index (both since January 1999 through July 2022). Note that the months-of-supply is not seasonally adjusted.
The last three months are in black showing a possible shift in the relationship.

There is much more in the article. You can subscribe at https://calculatedrisk.substack.com/


