 RSS Feed
 by Calculated Risk on 9/29/2022 09:02:00 PM
Thursday, September 29, 2022
Friday: Personal Income & Outlays, Chicago PMI
Friday:
• At 8:30 AM ET, Personal Income and Outlays, August 2022 and Annual Update The consensus is for a 0.3% increase in personal income, and for a 0.2% increase in personal spending. And for the Core PCE price index to increase 0.5%. PCE prices are expected to be up 6.0% YoY, and core PCE prices up 4.8% YoY.
• At 9:45 AM, Chicago Purchasing Managers Index for September. The consensus is for a reading of 52.0, down from 52.2 in August.
• At 10:00 AM, University of Michigan's Consumer sentiment index (Final for September). The consensus is for a reading of 59.5.
On COVID (focus on hospitalizations and deaths):
| COVID Metrics | ||||
|---|---|---|---|---|
| Now | Week Ago | Goal | ||
| New Cases per Day2 | 47,112 | 54,201 | ≤5,0001 | |
| Hospitalized2 | 23,401 | 25,449 | ≤3,0001 | |
| Deaths per Day2 | 343 | 368 | ≤501 | |
| 1my goals to stop daily posts, 27-day average for Cases, Currently Hospitalized, and Deaths 🚩 Increasing 7-day average week-over-week for Cases, Hospitalized, and Deaths ✅ Goal met. | ||||
 Click on graph for larger image.
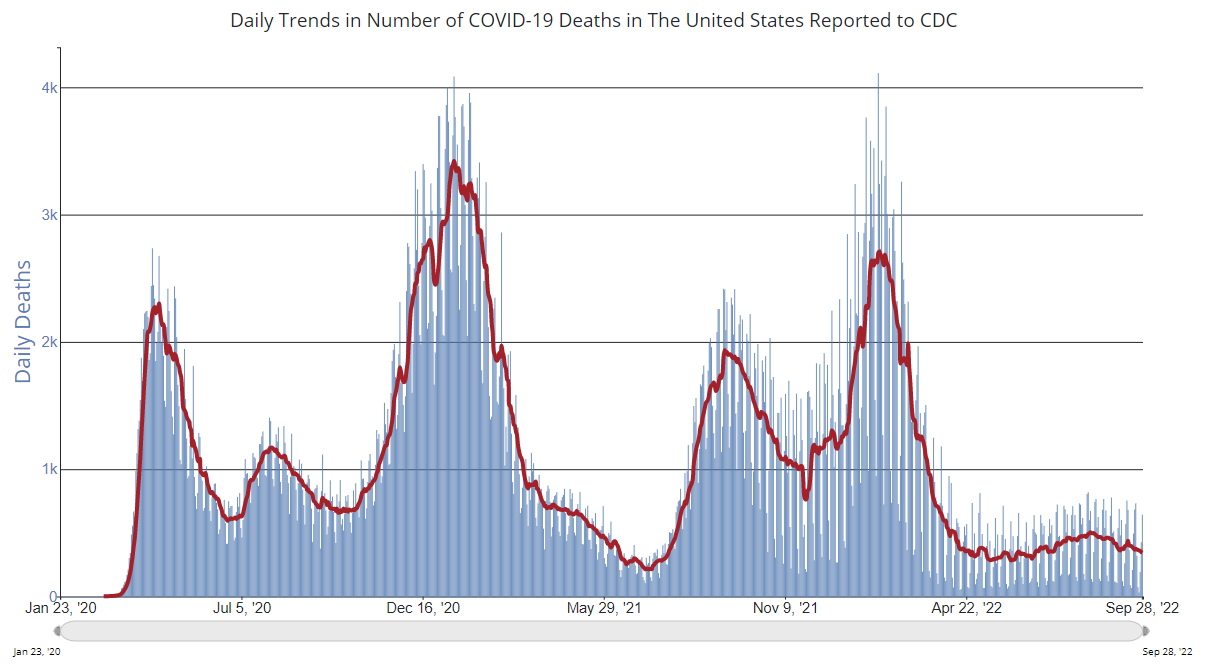
This graph shows the daily (columns) and 7-day average (line) of deaths reported.
NOTE: Cases have declined by more than half, and deaths lag cases - so we might see average daily deaths in the 200s soon (better, but still too high).
Average daily deaths bottomed in July 2021 at 214 per day.
Las Vegas August 2022: Visitor Traffic Down 10.9% Compared to 2019
by Calculated Risk on 9/29/2022 02:18:00 PM
Note: I like using Las Vegas as a measure of recovery for both leisure (visitors) and business (conventions).
From the Las Vegas Visitor Authority: August 2022 Las Vegas Visitor Statistics
August visitation reached nearly 3.2M visitors for the month, up +6.4% YoY and ‐10.9% below the August 2019 volume.
Overall hotel occupancy reached 76.8%, +4.0 pts ahead of last August but down ‐10.9 pts vs. August 2019. Surpassing 90% for the sixth straight month, Weekend occupancy reached 90.1% (up +3.0 pts YoY but down ‐5.1 pts vs. August 2019), while Midweek occupancy came in at 72.2% (up +4.4 pts YoY but down ‐11.9 pts vs. August 2019).
The trend of strong ADR continued as August ADR exceeded $148, +5.5% ahead of last August and 22.4% above August 2019 while RevPAR neared $114 for the month, +11.3% YoY and +7.2% over August 2019.
 Click on graph for larger image.
 The first graph shows visitor traffic for 2019 (dark blue), 2020 (light blue), 2021 (yellow) and 2022 (red)
Visitor traffic was down 10.9% compared to the same month in 2019.
Visitor traffic was up 6.4% compared to last August.
The second graph shows convention traffic.

Convention traffic was down 38.2% compared to August 2019.The second graph shows convention traffic.

Note: There was almost no convention traffic from April 2020 through May 2021.
Hotels: Occupancy Rate Down 1.5% Compared to Same Week in 2019
by Calculated Risk on 9/29/2022 11:51:00 AM
Note: The occupancy rate will increase next week due to Hurricane Ian.
From CoStar: STR: US Weekly Hotel Occupancy Reaches 70%
U.S. hotel performance increased from the previous week and showed improved comparisons with 2019, according to STR‘s latest data through Sept. 24.The following graph shows the seasonal pattern for the hotel occupancy rate using the four-week average.
Sept. 18-24, 2022 (percentage change from comparable week in 2019*):
• Occupancy: 70.0% (-1.5%)
• Average daily rate (ADR): $157.99 (+15.7%)
• Revenue per available room (RevPAR): $110.60 (+13.9%)
*Due to the pandemic impact, STR is measuring recovery against comparable time periods from 2019.
emphasis added
 Click on graph for larger image.
The red line is for 2022, black is 2020, blue is the median, and dashed light blue is for 2021. Dashed purple is 2019 (STR is comparing to a strong year for hotels).
The 4-week average of the occupancy rate is above the median rate for the previous 20 years (Blue).
Note: Y-axis doesn't start at zero to better show the seasonal change.
The 4-week average of the occupancy rate will increase during the Fall business travel period, and then decline into the Winter.
Inflation Adjusted House Prices Declined Further in July
by Calculated Risk on 9/29/2022 09:34:00 AM
Today, in the Calculated Risk Real Estate Newsletter: Inflation Adjusted House Prices Declined Further in July
Excerpt:
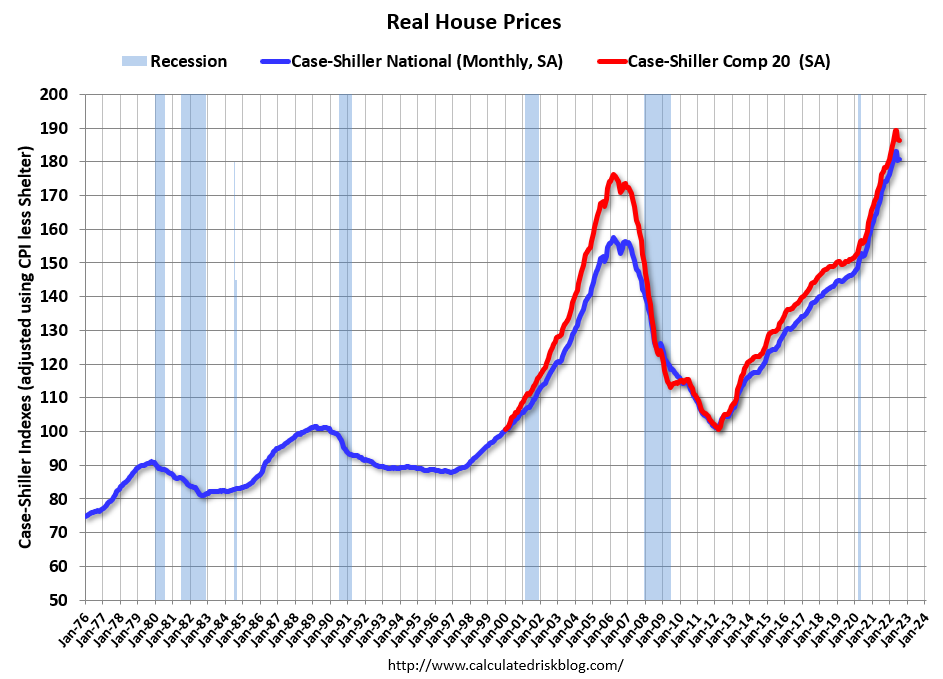
It has been over 16 years since the bubble peak. In the Case-Shiller release Tuesday, the seasonally adjusted National Index (SA), was reported as being 65% above the bubble peak in 2006. However, in real terms, the National index (SA) is about 15% above the bubble peak (and historically there has been an upward slope to real house prices). The composite 20, in real terms, is about 6% above the bubble peak.
People usually graph nominal house prices, but it is also important to look at prices in real terms (inflation adjusted). As an example, if a house price was $200,000 in January 2000, the price would be almost $338,000 today adjusted for inflation (69% increase). That is why the second graph below is important - this shows "real" prices (adjusted for inflation). ...
The second graph shows the same two indexes in real terms (adjusted for inflation using CPI less Shelter). Note: some people use other inflation measures to adjust for real prices. In real terms, the National index is 14.6% above the bubble peak, and the Composite 20 index is 5.6% above the bubble peak in early 2006.
This is the second consecutive month with declining real prices.
There is much more in the article. You can subscribe at https://calculatedrisk.substack.com/
Weekly Initial Unemployment Claims decrease to 193,000
by Calculated Risk on 9/29/2022 08:39:00 AM
The DOL reported:
In the week ending September 24, the advance figure for seasonally adjusted initial claims was 193,000, a decrease of 16,000 from the previous week's revised level. The previous week's level was revised down by 4,000 from 213,000 to 209,000. The 4-week moving average was 207,000, a decrease of 8,750 from the previous week's revised average. The previous week's average was revised down by 1,000 from 216,750 to 215,750.The following graph shows the 4-week moving average of weekly claims since 1971.
emphasis added
 Click on graph for larger image.
The dashed line on the graph is the current 4-week average. The four-week average of weekly unemployment claims decreased to 207,000.
The previous week was revised down.
Weekly claims were lower than the consensus forecast.
Q2 GDP Growth Unrevised at minus 0.6% Annual Rate
by Calculated Risk on 9/29/2022 08:35:00 AM
From the BEA: Gross Domestic Product (Third Estimate), GDP by Industry, and Corporate Profits (Revised), 2nd Quarter 2022 and Annual Update
Real gross domestic product (GDP) decreased at an annual rate of 0.6 percent in the second quarter of 2022, according to the "third" estimate released by the Bureau of Economic Analysis. In the first quarter, real GDP decreased 1.6 percent (same as previously published).Here is a Comparison of Third and Second Estimates. PCE growth was revised up from 1.5% to 2.0%. Residential investment was revised down from -16.2% to -17.8%.
The “third” estimate of GDP released today is based on more complete source data than were available for the "second" estimate issued last month. In the second estimate, the decrease in real GDP was also 0.6 percent. The update primarily reflected an upward revision to consumer spending that was offset by a downward revision to exports. Imports, which are a subtraction in the calculation of GDP, were revised down
...
Real gross domestic income (GDI) increased 0.1 percent in the second quarter, a downward revision of 1.3 percentage points from the previous estimate. The average of real GDP and real GDI, a supplemental measure of U.S. economic activity that equally weights GDP and GDI, decreased 0.3 percent in the second quarter, a downward revision of 0.7 percentage point.
emphasis added
Wednesday, September 28, 2022
Thursday: Unemployment Claims, GDP
by Calculated Risk on 9/28/2022 09:04:00 PM
 Thursday:
• At 8:30 AM ET, the initial weekly unemployment claims report will be released. The consensus is for an increase to 218 thousand from 213 thousand last week.
• Also, at 8:30 AM, Gross Domestic Product (Third Estimate), GDP by Industry, and Corporate Profits (Revised), 2nd Quarter 2022 and Annual Update The consensus is that real GDP decreased 0.6% annualized in Q2, unchanged from the second estimate of -0.6%.
On COVID (focus on hospitalizations and deaths):
| COVID Metrics | ||||
|---|---|---|---|---|
| Now | Week Ago | Goal | ||
| New Cases per Day2 | 50,397 | 55,529 | ≤5,0001 | |
| Hospitalized2 | 23,531 | 25,768 | ≤3,0001 | |
| Deaths per Day2 | 354 | 379 | ≤501 | |
| 1my goals to stop daily posts, 27-day average for Cases, Currently Hospitalized, and Deaths 🚩 Increasing 7-day average week-over-week for Cases, Hospitalized, and Deaths ✅ Goal met. | ||||
 Click on graph for larger image.
This graph shows the daily (columns) and 7-day average (line) of deaths reported.
NOTE: Cases have declined by more than half, and deaths lag cases - so we might see average daily deaths in the 200s soon (better, but still too high).
Average daily deaths bottomed in July 2021 at 214 per day.
A few comments on the Seasonal Pattern for House Prices
by Calculated Risk on 9/28/2022 04:17:00 PM
Two key points:
1) There is a clear seasonal pattern for house prices.
2) The surge in distressed sales during the housing bust distorted the seasonal pattern.
For in depth description of these issues, see Jed Kolko's article from 2014 "Let’s Improve, Not Ignore, Seasonal Adjustment of Housing Data"
Note: I was one of several people to question the change in the seasonal factor (here is a post in 2009) - and this led to S&P Case-Shiller questioning the seasonal factor too (from April 2010). I still use the seasonal factor (I think it is better than using the NSA data).
 Click on graph for larger image.
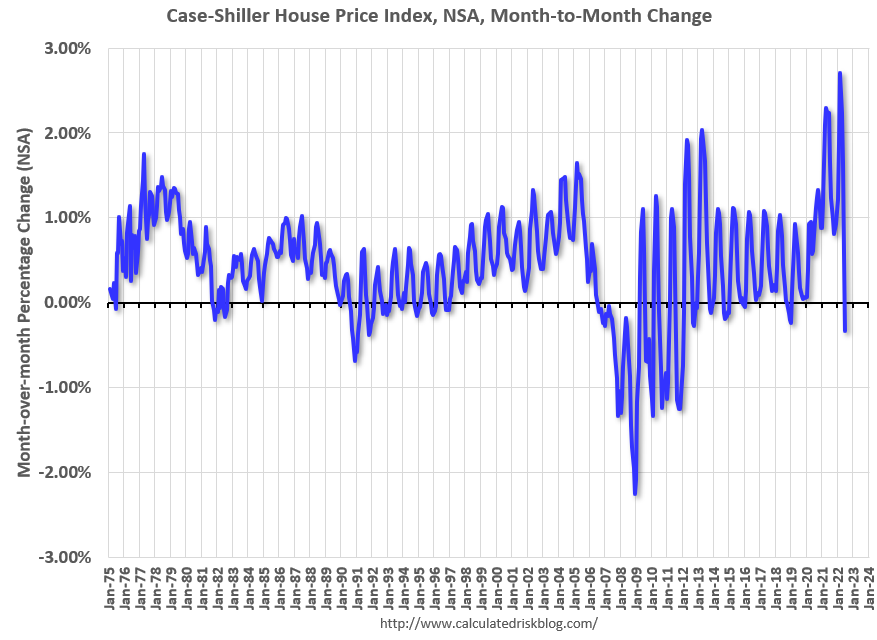
This graph shows the month-to-month change in the NSA Case-Shiller National index since 1987 (through July 2022). The seasonal pattern was smaller back in the '90s and early '00s and increased once the bubble burst.
The seasonal swings declined following the bust, however the recent price surge changed the month-over-month pattern.
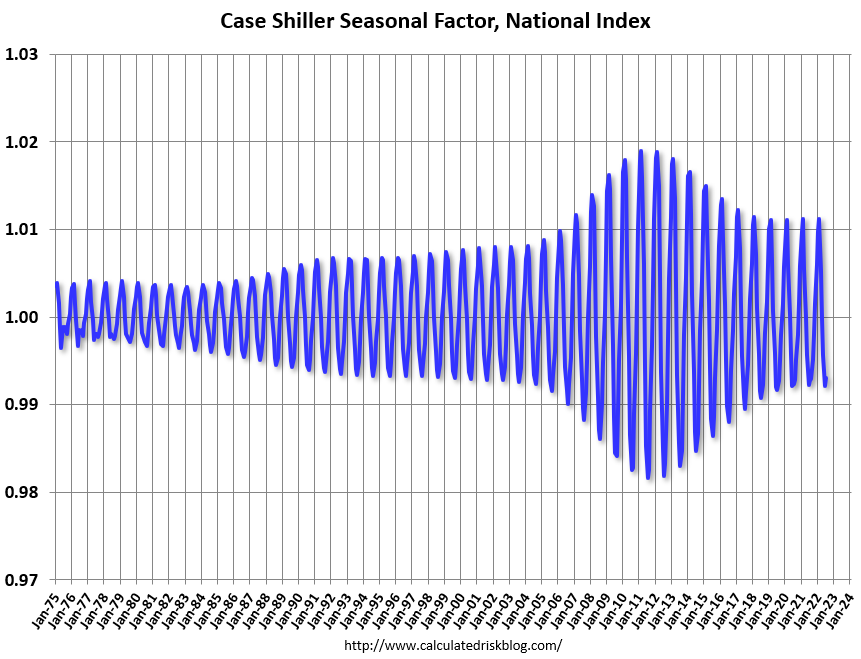 The second graph shows the seasonal factors for the Case-Shiller National index since 1987. The factors started to change near the peak of the bubble, and really increased during the bust since normal sales followed the regular seasonal pattern - and distressed sales happened all year.
The swings in the seasonal factors have decreased, and the seasonal factors had been moving back towards more normal levels.
Note that the recent price surge hasn't distorted the seasonal factors. Unless there is a wave of distressed sales (unlikely due to mostly solid lending), the seasonal pattern won't be distorted like during the housing bust.
Pace of Rent Increases Continues to Slow
by Calculated Risk on 9/28/2022 11:15:00 AM
Today, in the Calculated Risk Real Estate Newsletter: Pace of Rent Increases Continues to Slow
A brief excerpt:
Here is a graph of the year-over-year (YoY) change for these measures since January 2015. All of these measures are through August 2022 (Apartment List through September 2022).There is much more in the article. You can subscribe at https://calculatedrisk.substack.com/
Note that new lease measures (Zillow, Apartment List) dipped early in the pandemic, whereas the BLS measures were steady. Then new leases took off, and the BLS measures are picking up.
...
The Zillow measure is up 12.3% YoY in August, down from 13.8% YoY in July. This is down from a peak of 17.2% YoY in February.
The ApartmentList measure is up 7.5% YoY as of September, down from 9.8% in August. This is down from the peak of 18.0% YoY last November.
Rents are still increasing, and we should expect this to continue to spill over into measures of inflation. The Owners’ Equivalent Rent (OER) was up 6.3% YoY in August, from 5.8% YoY in July - and will likely increase further in the coming months.
...
My suspicion is rent increases will slow further over the coming months as the pace of household formation slows, and more supply comes on the market.

NAR: Pending Home Sales Decreased 2.0% in August
by Calculated Risk on 9/28/2022 10:03:00 AM
From the NAR: Pending Home Sales Dropped 2.0% in August
Pending home sales sagged for the third straight month in August, according to the National Association of REALTORS®. Three out of four major regions experienced month-over-month decreases in transactions, however, the West saw a modest gain. Year-over-year, all four regions posted double-digit declines.This was a larger decline than expected for this index. Note: Contract signings usually lead sales by about 45 to 60 days, so this would usually be for closed sales in September and October.
The Pending Home Sales Index (PHSI), a forward-looking indicator of home sales based on contract signings, fell 2.0% to 88.4 in August. Year-over-year, pending transactions dwindled by 24.2%. An index of 100 is equal to the level of contract activity in 2001.
"The direction of mortgage rates – upward or downward – is the prime mover for home buying, and decade-high rates have deeply cut into contract signings," said NAR Chief Economist Lawrence Yun. "If mortgage rates moderate and the economy continues adding jobs, then home buying should also stabilize."
...
The Northeast PHSI decreased 3.4% from last month to 76.6, down 19.0% from August 2021. The Midwest index fell 5.2% to 88.4 in August, a 21.1% drop from the previous year.
The South PHSI slid 0.9% to 105.4 in August, a decline of 24.2% from a year ago. The West index rose by 1.4% in August to 71.0, down 31.3% from August 2021.
emphasis added


