 RSS Feed
 by Calculated Risk on 9/26/2022 08:36:00 AM
Monday, September 26, 2022
Four High Frequency Indicators for the Economy
These indicators are mostly for travel and entertainment. It is interesting to watch these sectors recover as the pandemic subsides. Notes: I've added back gasoline supplied to see if there is an impact from higher gasoline prices.
The TSA is providing daily travel numbers.
This data is as of September 25th.
 Click on graph for larger image.
This data shows the 7-day average of daily total traveler throughput from the TSA for 2019 (Light Blue), 2020 (Black), 2021 (Blue) and 2022 (Red).
The dashed line is the percent of 2019 for the seven-day average.
The 7-day average is down 2.7% from the same day in 2019 (90.9% of 2019). (Dashed line)
Air travel - as a percent of 2019 - had been moving sideways over the last several months, off about 10% from 2019. Travel has picked up recently compared to 2019.
 This data shows domestic box office for each week and the median for the years 2016 through 2019 (dashed light blue).
 Black is 2020, Blue is 2021 and Red is 2022.
The data is from BoxOfficeMojo through September 22nd.
Note that the data is usually noisy week-to-week and depends on when blockbusters are released.
Movie ticket sales were at $71 million last week, down about 52% from the median for the week.
Note that the data is usually noisy week-to-week and depends on when blockbusters are released.
Movie ticket sales were at $71 million last week, down about 52% from the median for the week.
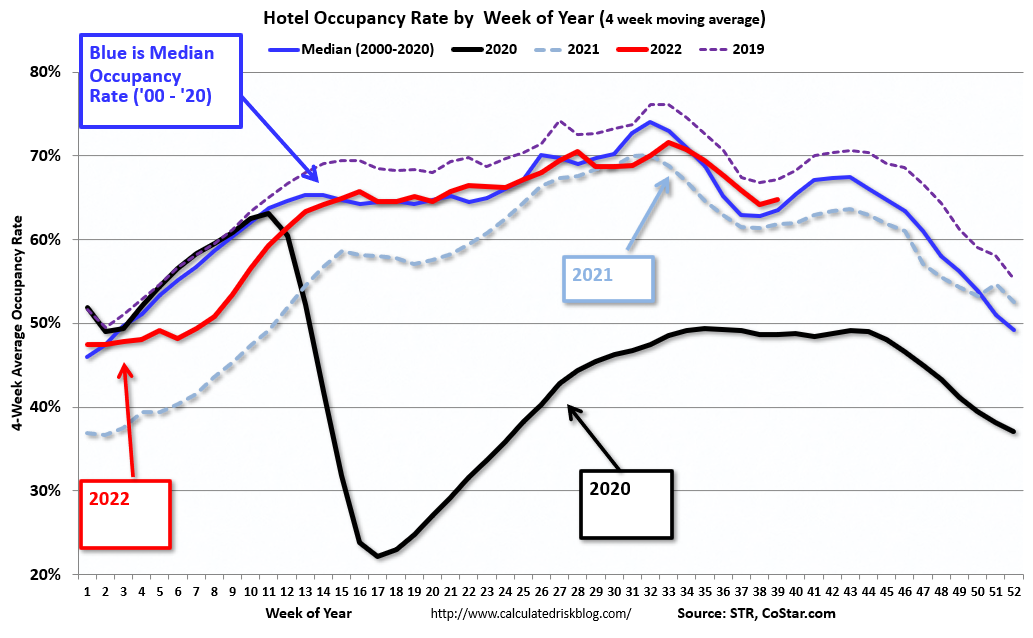 This graph shows the seasonal pattern for the hotel occupancy rate using the four-week average.
 The red line is for 2022, black is 2020, blue is the median, and dashed light blue is for 2021. Dashed purple is 2019 (STR is comparing to a strong year for hotels).
This data is through Sept 17th. The occupancy rate was down 2.4% compared to the same week in 2019.
The 4-week average of the occupancy rate is above the median rate for the previous 20 years (Blue).
Notes: Y-axis doesn't start at zero to better show the seasonal change.
Notes: Y-axis doesn't start at zero to better show the seasonal change.

This graph, based on weekly data from the U.S. Energy Information Administration (EIA), shows gasoline supplied compared to the same week of 2019.
Blue is for 2020. Purple is for 2021, and Red is for 2022.
As of September 16th, gasoline supplied was down 6.9% compared to the same week in 2019.
Recently gasoline supplied has been running below 2019 and 2021 levels - and sometimes below 2020.
Sunday, September 25, 2022
Sunday Night Futures
by Calculated Risk on 9/25/2022 06:32:00 PM
Weekend:
• Schedule for Week of September 25, 2022
Monday:
• At 8:30 AM ET, Chicago Fed National Activity Index for August. This is a composite index of other data.
• At 10:30 AM, Dallas Fed Survey of Manufacturing Activity for September.
From CNBC: Pre-Market Data and Bloomberg futures S&P 500 are down 6 and DOW futures are down 42 (fair value).
Oil prices were down over the last week with WTI futures at $78.74 per barrel and Brent at $86.15 per barrel. A year ago, WTI was at $75, and Brent was at $79 - so WTI oil prices are up 5% year-over-year.
Here is a graph from Gasbuddy.com for nationwide gasoline prices. Nationally prices are at $3.65 per gallon. A year ago, prices were at $3.17 per gallon, so gasoline prices are up $0.48 per gallon year-over-year.
Monthly Mortgage Payments Up Record Year-over-year
by Calculated Risk on 9/25/2022 11:58:00 AM
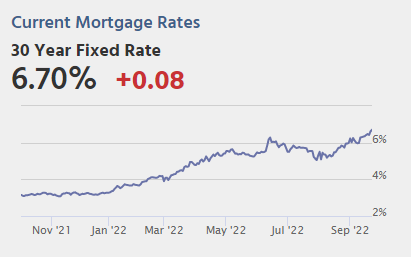
On Friday, the average 30-year mortgage rate hit 6.7% for zero points and top tier scenarios. This was the highest rate in 14 years and is close to the highest rate in over 20 years (above 6.76% will be the highest since early 2002).
Here is a graph showing the 30-year rate using Freddie Mac PMMS, and MND for last week.
 Click on graph for larger image.
This is a graph from Mortgage News Daily (MND) showing 30-year fixed rates from three sources (MND, MBA, Freddie Mac) over the last 5 years.
Yes, rates were much higher in the 1980 period, but it is the change in monthly payments that impacts housing. Monthly payments include principal, interest, taxes, insurance (PITI), and sometimes HOA fees (Homeowners Association). We could also include maintenance, utilities and other costs.
The following graph shows the year-over-year change in principal & interest (P&I) assuming a fixed loan amount since 1977. Currently P&I is up about 52% year-over-year for a fixed amount (this doesn’t take into account the change in house prices).
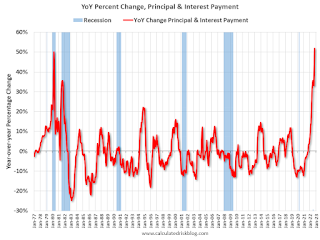 This is above the previous record increase of 50% in 1980. This assumed a fixed loan amount - if we add in the year-over-year increase in house prices, payments would be up around 65% YoY for the same house.
This is one of the reasons I've argued in my real estate newsletter Housing: Don't Compare the Current Housing Boom to the Bubble and Bust, Look instead at the 1978 to 1982 period for lessons.
Saturday, September 24, 2022
Real Estate Newsletter Articles this Week
by Calculated Risk on 9/24/2022 02:11:00 PM
At the Calculated Risk Real Estate Newsletter this week:
• August Housing Starts: Record Number of Housing Units Under Construction
• NAR: Existing-Home Sales Decreased Slightly to 4.80 million SAAR in August
• Why Measures of Existing Home Inventory appear Different
• Final Look at Local Housing Markets in August
• 3rd Look at Local Housing Markets in August
This is usually published 4 to 6 times a week and provides more in-depth analysis of the housing market.
You can subscribe at https://calculatedrisk.substack.com/
Most content is available for free (and no Ads), but please subscribe!
Schedule for Week of September 25, 2022
by Calculated Risk on 9/24/2022 08:11:00 AM
The key reports this week are August New Home sales, the third estimate of Q2 GDP, Personal Income and Outlays for August, and Case-Shiller house prices for July.
For manufacturing, the Richmond and Dallas Fed manufacturing surveys will be released this week.
8:30 AM ET: Chicago Fed National Activity Index for August. This is a composite index of other data.
10:30 AM: Dallas Fed Survey of Manufacturing Activity for September.
8:30 AM: Durable Goods Orders for August from the Census Bureau. The consensus is for a 0.1% decrease in durable goods orders.
 9:00 AM: S&P/Case-Shiller House Price Index for July.
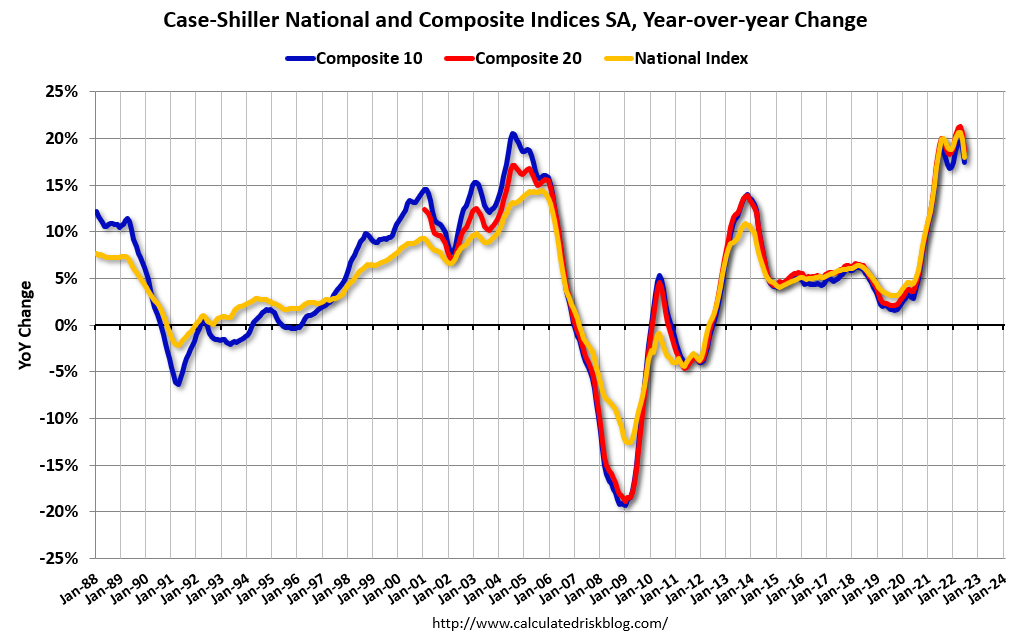
This graph shows the year-over-year change in the seasonally adjusted National Index, Composite 10 and Composite 20 indexes through the most recent report (the Composite 20 was started in January 2000).
The consensus is for a 17.0% year-over-year increase in the Comp 20 index for July.
9:00 AM: FHFA House Price Index for July. This was originally a GSE only repeat sales, however there is also an expanded index.
 10:00 AM: New Home Sales for August from the Census Bureau.
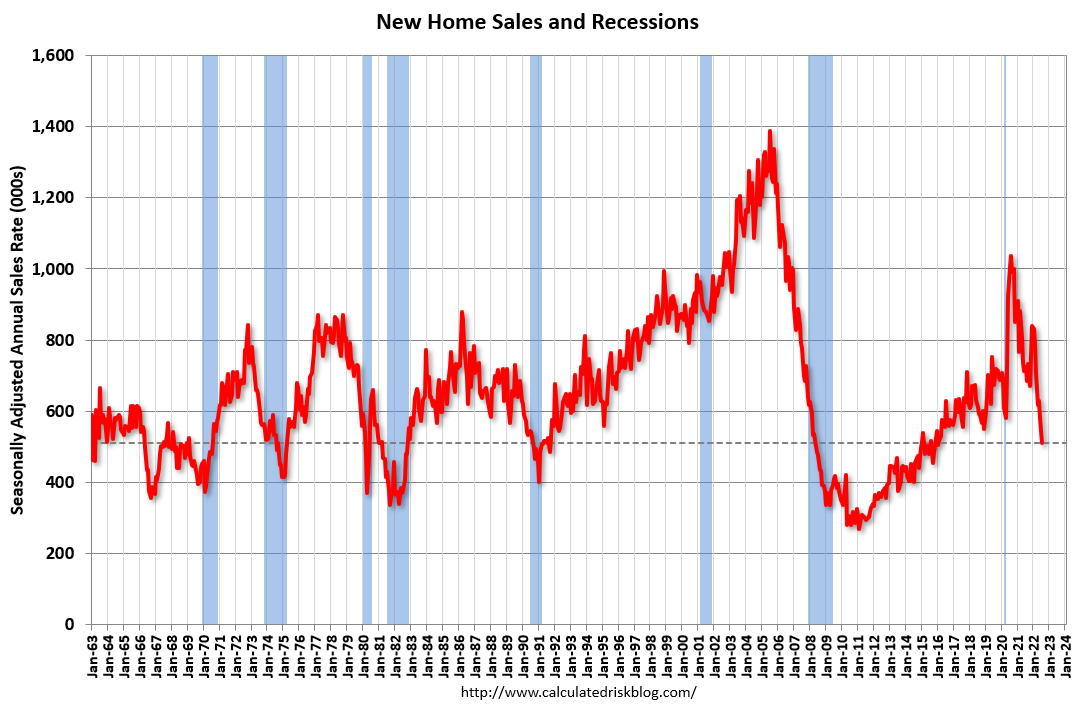
 This graph shows New Home Sales since 1963. The dashed line is the sales rate for last month.
The consensus is for 500 thousand SAAR, down from 511 thousand in July.
10:00 AM: the Richmond Fed manufacturing survey for September. This is the last of the regional surveys for September.
7:00 AM ET: The Mortgage Bankers Association (MBA) will release the results for the mortgage purchase applications index.
10:00 AM: Pending Home Sales Index for August. The consensus is 1.0% decrease in the index.
8:30 AM: The initial weekly unemployment claims report will be released. The consensus is for an increase to 218 thousand from 213 thousand last week.
8:30 AM: Gross Domestic Product (Third Estimate), GDP by Industry, and Corporate Profits (Revised), 2nd Quarter 2022 and Annual Update The consensus is that real GDP decreased 0.6% annualized in Q2, unchanged from the second estimate of -0.6%.
8:30 AM: Personal Income and Outlays, August 2022 and Annual Update The consensus is for a 0.3% increase in personal income, and for a 0.2% increase in personal spending. And for the Core PCE price index to increase 0.5%. PCE prices are expected to be up 6.0% YoY, and core PCE prices up 4.8% YoY.
9:45 AM: Chicago Purchasing Managers Index for September. The consensus is for a reading of 52.0, down from 52.2 in August.
10:00 AM: University of Michigan's Consumer sentiment index (Final for September). The consensus is for a reading of 59.5.
Friday, September 23, 2022
COVID Sept 23, 2022, Update on Cases, Hospitalizations and Deaths
by Calculated Risk on 9/23/2022 08:42:00 PM
 From Matthew Graham at MortgageNewsDaily: Hits Keep Coming For Mortgage Market (The Bad Kind)
The positive close on a volatile Fed day offered false hope for rates--a fact that was laid bare with Thursday's massive sell-off. Now on Friday, more false hope as another massive overnight sell-off gave way to a full recovery by 9:20am. Since then, however, it's been all sellers.On COVID (focus on hospitalizations and deaths):
In other words, bond tanked again.
| COVID Metrics | ||||
|---|---|---|---|---|
| Now | Week Ago | Goal | ||
| New Cases per Day2 | 53,376 | 62,577 | ≤5,0001 | |
| Hospitalized2 | 24,764 | 27,762 | ≤3,0001 | |
| Deaths per Day2 | 356 | 428 | ≤501 | |
| 1my goals to stop daily posts, 27-day average for Cases, Currently Hospitalized, and Deaths 🚩 Increasing 7-day average week-over-week for Cases, Hospitalized, and Deaths ✅ Goal met. | ||||
 Click on graph for larger image.
This graph shows the daily (columns) and 7-day average (line) of deaths reported.
NOTE: Cases have declined by more than half, and deaths lag cases - so we might see average daily deaths in the 200s soon (good news, but still too high).
Average daily deaths bottomed in July 2021 at 214 per day.
September Vehicle Sales Forecast: Increase to 13.7 million SAAR
by Calculated Risk on 9/23/2022 04:09:00 PM
From WardsAuto: September U.S. Light-Vehicle Sales Tracking to 5-Month High (pay content). Brief excerpt:
"Despite the amount of pent-up demand waiting to be tapped, without an increase in incentives combined with dealers selling fewer vehicles above sticker price, waning availability of affordable offerings on dealer lots will cause sales gains to lag the expected growth in inventory."
 Click on graph for larger image.
This graph shows actual sales from the BEA (Blue), and Wards forecast for September (Red).
The Wards forecast of 13.7 million SAAR, would be mostly up 4% from last month, and up 11% from a year ago (sales started to weaken in mid-2021, due to supply chain issues).
Vehicle sales are usually a transmission mechanism for Federal Open Market Committee (FOMC) policy (far behind housing). However, this time, vehicle sales have been suppressed by supply chain issues, and will probably not be significantly impacted by higher interest rates.
Why Measures of Existing Home Inventory appear Different
by Calculated Risk on 9/23/2022 01:17:00 PM
Today, in the Calculated Risk Real Estate Newsletter: Why Measures of Existing Home Inventory appear Different
A brief excerpt:
There is a significant difference between measures of inventory, and this is leading to some confusion.There is much more in the article. You can subscribe at https://calculatedrisk.substack.com/
...
Here is a graph comparing the year-over-year change in Realtor.com’s active inventory, the NAR’s inventory, and Realtor.com inventory including pending sales. Note that the blue line (NAR) and dashed black line (Realtor including pending sales) track.
As Lawler noted, including pending sales understated the decline in active inventory in 2020 and 2021, and is now understating the increase in active inventory.
But what about Redfin? Redfin takes a very different approach. Their active inventory number for any month includes homes that came on the market and sold quickly during the month, whereas the other measures are a snapshot at the end of the month (or week).

Q3 GDP Tracking: Close to 1%
by Calculated Risk on 9/23/2022 09:54:00 AM
From BofA:
On net, August data on housing starts and existing home sales boosted our tracking estimate for residential investment modestly. After rounding, however, our 3Q US GDP tracking remained unchanged at 0.8% qoq saar. [September 23rd estimate]From Goldman:
emphasis added
We left our Q3 GDP tracking estimate unchanged at +1.2% (qoq ar). [September 21st estimate]And from the Altanta Fed: GDPNow
The GDPNow model estimate for real GDP growth (seasonally adjusted annual rate) in the third quarter of 2022 is 0.3 percent on September 20, down from 0.5 percent on September 15. After this morning's housing starts report from the US Census Bureau, the nowcast of third-quarter residential investment growth decreased from -20.8 percent to -24.5 percent. [September 20th estimate]
Black Knight: Mortgage Delinquency Rate decreased in August
by Calculated Risk on 9/23/2022 08:11:00 AM
From Black Knight: Black Knight: Mortgage Delinquencies Near Record Low in August; Foreclosure Starts Up 15% from July, Still More Than 40% Below Pre-Pandemic Levels
• The national delinquency rate fell 3.6% in August to 2.79%, just 4 basis points above May 2022’s record lowAccording to Black Knight's First Look report, the percent of loans delinquent decreased 3.6% in August compared to July and decreased 30% year-over-year.
• Improvement was broad-based, with the number of borrowers a single payment past due falling by 4% and those 90 or more days delinquent down 4.5%
• After dropping steadily over recent months, cure activity also improved in August, with 62K seriously delinquent loans curing to current status, up from 58K in July
• The month’s 20.3K foreclosure starts represent a 15% jump in activity from July, but remain 44% below August 2019 levels
• Likewise, starts were initiated on 3.4% of serious delinquencies; up slightly from July but still less than half the rate seen in the years leading up to the pandemic
• Prepays (SMM) edged up 1.5% for the month, due to calendar-related effects, but are still down by 69% year-over-year as rising rates continue to put downward pressure on both purchase and refinance lending
emphasis added
Black Knight reported the U.S. mortgage delinquency rate (loans 30 or more days past due, but not in foreclosure) was 2.79% in August, down from 2.89% in July.
The percent of loans in the foreclosure process increased in August to 0.35%, from 0.35% in July.
The number of delinquent properties, but not in foreclosure, is down 633,000 properties year-over-year, and the number of properties in the foreclosure process is up 43,000 properties year-over-year.
| Black Knight: Percent Loans Delinquent and in Foreclosure Process | ||||
|---|---|---|---|---|
| August 2022 | July 2022 | August 2021 | August 2020 | |
| Delinquent | 2.79% | 2.89% | 4.00% | 6.88% |
| In Foreclosure | 0.35% | 0.35% | 0.27% | 0.35% |
| Number of properties: | ||||
| Number of properties that are delinquent, but not in foreclosure: | 1,489,000 | 1,543,000 | 2,122,000 | 3,679,000 |
| Number of properties in foreclosure pre-sale inventory: | 185,000 | 184,000 | 142,000 | 187,000 |
| Total Properties | 1,674,000 | 1,728,000 | 2,264,000 | 3,867,000 |


