 RSS Feed
 by Calculated Risk on 9/22/2022 06:33:00 PM
Thursday, September 22, 2022
LA Port Traffic: Inbound Declined in August
Notes: The expansion to the Panama Canal was completed in 2016 (As I noted a few years ago), and some of the traffic that used the ports of Los Angeles and Long Beach is probably going through the canal. This might be impacting TEUs on the West Coast.
Container traffic gives us an idea about the volume of goods being exported and imported - and usually some hints about the trade report since LA area ports handle about 40% of the nation's container port traffic.
The following graphs are for inbound and outbound traffic at the ports of Los Angeles and Long Beach in TEUs (TEUs: 20-foot equivalent units or 20-foot-long cargo container).
To remove the strong seasonal component for inbound traffic, the first graph shows the rolling 12-month average.
 Click on graph for larger image.
On a rolling 12-month basis, inbound traffic decreased 1.0% in August compared to the rolling 12 months ending in July. Outbound traffic increased 0.1% compared to the rolling 12 months ending the previous month.
The 2nd graph is the monthly data (with a strong seasonal pattern for imports).
 Usually imports peak in the July to October period as retailers import goods for the Christmas holiday, and then decline sharply and bottom in February or March depending on the timing of the Chinese New Year.
Imports were down 12% YoY in August, and exports were up 1% YoY.
It is possible that exports have bottomed after declining for several years (even prior to pandemic).
Realtor.com Reports Weekly Active Inventory Up 28% Year-over-year; New Listings Down 10%
by Calculated Risk on 9/22/2022 02:17:00 PM
Realtor.com has monthly and weekly data on the existing home market. Here is their weekly report released yesterday from Chief Economist Danielle Hale and Jiayi Xu: Weekly Housing Trends View — Data Week Ending Sep 17, 2022. Note: They have data on list prices, new listings and more, but this focus is on inventory.
• Active inventory continued to grow, and improved 28% above one year ago. . The number of homes for sale has grown as buyers and sellers navigate a rebalancing housing market with shifting advantages and challenges.
...
• New listings–a measure of sellers putting homes up for sale–were again down, dropping 10% from one year ago.. This week marks the eleventh straight week of year over year declines in the number of new listings coming up for sale, and this week the data continues to maintain at double-digit territory.
 Here is a graph of the year-over-year change in inventory according to realtor.com.
 Note the rapid increase in the YoY change earlier this year, from down 30% at the beginning of the year, to up 29% YoY at the beginning of July.
However, the Realtor.com data has been stuck at up around 26% to 30% YoY for 12 weeks in a row. This is due to the slowdown in new listings, even as sales have fallen sharply.
Hotels: Occupancy Rate Down 2.4% Compared to Same Week in 2019
by Calculated Risk on 9/22/2022 12:32:00 PM
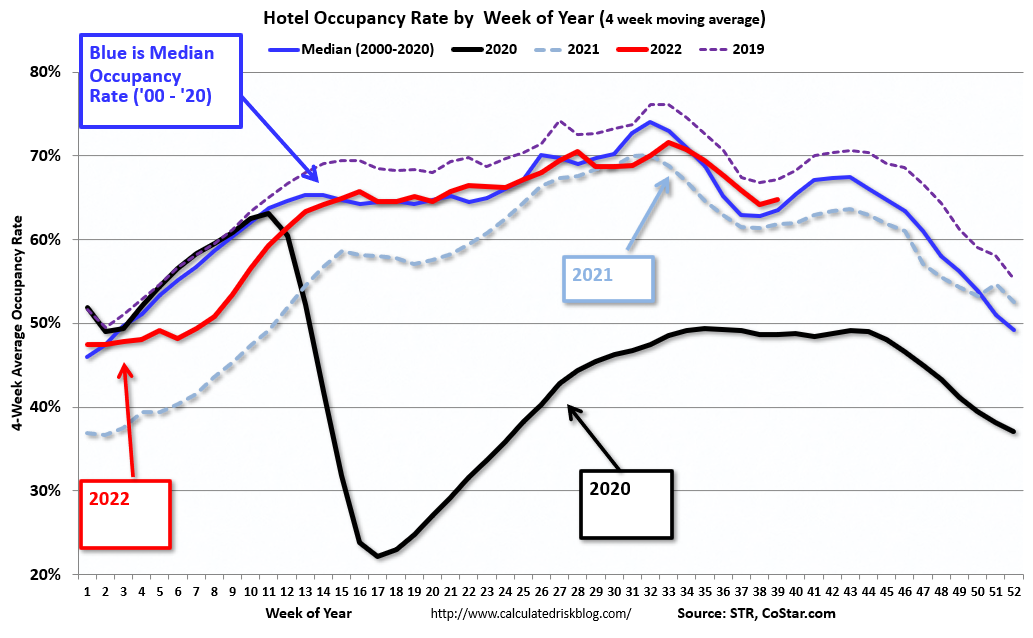
U.S. hotel performance increased from the previous week and showed improved comparisons with 2019, according to STR‘s latest data through Sept. 17.The following graph shows the seasonal pattern for the hotel occupancy rate using the four-week average.
Sept. 11-17, 2022 (percentage change from comparable week in 2019*):
• Occupancy: 69.6% (-2.4%)
• Average daily rate (ADR): $155.58 (+15.6%)
• Revenue per available room (RevPAR): $108.25 (+12.9%)
*Due to the pandemic impact, STR is measuring recovery against comparable time periods from 2019.
emphasis added
 Click on graph for larger image.
The red line is for 2022, black is 2020, blue is the median, and dashed light blue is for 2021. Dashed purple is 2019 (STR is comparing to a strong year for hotels).
The 4-week average of the occupancy rate is above the median rate for the previous 20 years (Blue).
Note: Y-axis doesn't start at zero to better show the seasonal change.
The 4-week average of the occupancy rate will increase during the Fall business travel period, and then decline into the Winter.
Final Look at Local Housing Markets in August
by Calculated Risk on 9/22/2022 09:32:00 AM
Today, in the Calculated Risk Real Estate Newsletter: Final Look at Local Housing Markets in August
A brief excerpt:
The big story for August existing home sales was the sharp year-over-year (YoY) decline in sales. Another key story was that new listings were down YoY in August as the sellers’ strike continued. And active listings were up. Also, median prices are falling nationally (more than normal seasonally).There is much more in the article. You can subscribe at https://calculatedrisk.substack.com/
This is the final look at local markets in August. I’m tracking about 35 local housing markets in the US. Some of the 35 markets are states, and some are metropolitan areas. I update these tables throughout the month as additional data is released.
...
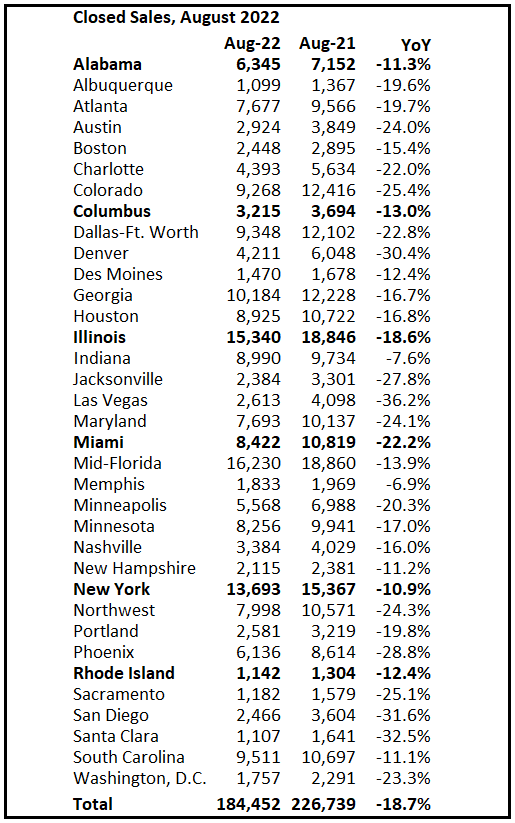
And a table of August sales. In August, sales in these markets were down 18.7% YoY. The NAR reported sales were down 17.4% NSA YoY. Contracts for sales in August were mostly signed in June and July, and we are seeing the impact of higher mortgage rates on August closings.
...
Looking ahead: In September 2022, there were the same number of working days as in September 2021, so the SA and NSA declines in sales will be similar.
Weekly Initial Unemployment Claims at 213,000
by Calculated Risk on 9/22/2022 08:32:00 AM
The DOL reported:
In the week ending September 17, the advance figure for seasonally adjusted initial claims was 213,000, an increase of 5,000 from the previous week's revised level. The previous week's level was revised down by 5,000 from 213,000 to 208,000. The 4-week moving average was 216,750, a decrease of 6,000 from the previous week's revised average. The previous week's average was revised down by 1,250 from 224,000 to 222,750.The following graph shows the 4-week moving average of weekly claims since 1971.
emphasis added
 Click on graph for larger image.
The dashed line on the graph is the current 4-week average. The four-week average of weekly unemployment claims decreased to 216,750.
The previous week was revised down.
Weekly claims were close to the consensus forecast.
Wednesday, September 21, 2022
Thursday: Unemployment Claims
by Calculated Risk on 9/21/2022 08:44:00 PM
 Thursday:
• At 8:30 AM ET, The initial weekly unemployment claims report will be released. The consensus is for an increase to 218 thousand from 213 thousand last week.
• At 11:00 AM, the Kansas City Fed manufacturing survey for September.
On COVID (focus on hospitalizations and deaths):
| COVID Metrics | ||||
|---|---|---|---|---|
| Now | Week Ago | Goal | ||
| New Cases per Day2 | 55,332 | 60,783 | ≤5,0001 | |
| Hospitalized2 | 25,406 | 28,571 | ≤3,0001 | |
| Deaths per Day2 | 356 | 381 | ≤501 | |
| 1my goals to stop daily posts, 27-day average for Cases, Currently Hospitalized, and Deaths 🚩 Increasing 7-day average week-over-week for Cases, Hospitalized, and Deaths ✅ Goal met. | ||||
 Click on graph for larger image.
This graph shows the daily (columns) and 7-day average (line) of deaths reported.
NOTE: Cases have declined by more than half, and deaths lag cases - so we might see average daily deaths in the 200s soon (good news, but still too high).
Average daily deaths bottomed in July 2021 at 214 per day.
FOMC Projections and Press Conference
by Calculated Risk on 9/21/2022 02:18:00 PM
Statement here.
Fed Chair Powell press conference video here or on YouTube here, starting at 2:30 PM ET.
Here are the projections. In June, most participants expected thirteen 25bp rate hikes in 2022. The FOMC raised rates 25 bp in March, 50 bp in May, 75 bp in June, 75 bp in July and 75 bp in September. That is twelve 25 bp increases so far, and the Fed expects rates to rise another 150 bp. So, it now appears the FOMC is expecting eighteen 25bp rate hikes this year.
Wall Street forecasts have been revised down further since June due to the ongoing negative impacts from the pandemic, the war in Ukraine and financial tightening. The FOMC also lowered their 2022 and 2023 projections down significantly.
| GDP projections of Federal Reserve Governors and Reserve Bank presidents, Change in Real GDP1 | ||||
|---|---|---|---|---|
| Projection Date | 2022 | 2023 | 2024 | |
| Sept 2022 | 0.1 to 0.3 | 0.5 to 1.5 | 1.4 to 2.0 | |
| June 2022 | 1.5 to 1.9 | 1.3 to 2.0 | 1.5 to 2.0 | |
The unemployment rate was at 3.7% in August. The FOMC increased their projections for the unemployment rate for Q4 2022. And are now projecting an employment recession in 2023.
| Unemployment projections of Federal Reserve Governors and Reserve Bank presidents, Unemployment Rate2 | ||||
|---|---|---|---|---|
| Projection Date | 2022 | 2023 | 2024 | |
| Sept 2022 | 3.8 to 3.9 | 4.1 to 4.5 | 4.0 to 4.6 | |
| June 2022 | 3.6 to 3.8 | 3.8 to 4.1 | 3.9 to 4.1 | |
As of July 2022, PCE inflation was up 6.3% from July 2021. The FOMC revised up their inflation projections for 2022.
| Inflation projections of Federal Reserve Governors and Reserve Bank presidents, PCE Inflation1 | ||||
|---|---|---|---|---|
| Projection Date | 2022 | 2023 | 2024 | |
| Sept 2022 | 5.3 to 5.7 | 2.6 to 3.5 | 2.1 to 2.6 | |
| June 2022 | 5.0 to 5.3 | 2.4 to 3.0 | 2.0 to 2.5 | |
PCE core inflation was up 4.6% in July year-over-year. And the FOMC revised up their projections.
| Core Inflation projections of Federal Reserve Governors and Reserve Bank presidents, Core Inflation1 | ||||
|---|---|---|---|---|
| Projection Date | 2022 | 2023 | 2024 | |
| Sept 2022 | 4.4 to 4.6 | 3.0 to 3.4 | 2.2 to 2.5 | |
| June 2022 | 4.2 to 4.5 | 2.5 to 3.2 | 2.1 to 2.5 | |
FOMC Statement: Raise Rates 75 bp; "Ongoing increases appropriate"
by Calculated Risk on 9/21/2022 02:02:00 PM
Fed Chair Powell press conference video here or on YouTube here, starting at 2:30 PM ET.
FOMC Statement:
Recent indicators point to modest growth in spending and production. Job gains have been robust in recent months, and the unemployment rate has remained low. Inflation remains elevated, reflecting supply and demand imbalances related to the pandemic, higher food and energy prices, and broader price pressures.
Russia's war against Ukraine is causing tremendous human and economic hardship. The war and related events are creating additional upward pressure on inflation and are weighing on global economic activity. The Committee is highly attentive to inflation risks.
The Committee seeks to achieve maximum employment and inflation at the rate of 2 percent over the longer run. In support of these goals, the Committee decided to raise the target range for the federal funds rate to 3 to 3-1/4 percent and anticipates that ongoing increases in the target range will be appropriate. In addition, the Committee will continue reducing its holdings of Treasury securities and agency debt and agency mortgage-backed securities, as described in the Plans for Reducing the Size of the Federal Reserve's Balance Sheet that were issued in May. The Committee is strongly committed to returning inflation to its 2 percent objective.
In assessing the appropriate stance of monetary policy, the Committee will continue to monitor the implications of incoming information for the economic outlook. The Committee would be prepared to adjust the stance of monetary policy as appropriate if risks emerge that could impede the attainment of the Committee's goals. The Committee's assessments will take into account a wide range of information, including readings on public health, labor market conditions, inflation pressures and inflation expectations, and financial and international developments.
Voting for the monetary policy action were Jerome H. Powell, Chair; John C. Williams, Vice Chair; Michael S. Barr; Michelle W. Bowman; Lael Brainard; James Bullard; Susan M. Collins; Lisa D. Cook; Esther L. George; Philip N. Jefferson; Loretta J. Mester; and Christopher J. Waller.
emphasis added
More Analysis on August Existing Home Sales
by Calculated Risk on 9/21/2022 10:51:00 AM
Today, in the CalculatedRisk Real Estate Newsletter: NAR: Existing-Home Sales Decreased Slightly to 4.80 million SAAR in August
Excerpt:
On prices, the NAR reported:There is much more in the article. You can subscribe at https://calculatedrisk.substack.com/ (Most content is available for free, so please subscribe).The median existing-home price for all housing types in August was $389,500, a 7.7% jump from August 2021 ($361,500), as prices ascended in all regions. This marks 126 consecutive months of year-over-year increases, the longest-running streak on record. However, it was the second month in a row that the median sales price retracted after reaching a record high of $413,800 in June, the usual seasonal trend of prices declining after peaking in the early summer.Median prices are distorted by the mix (repeat sales indexes like Case-Shiller and FHFA are probably better for measuring prices).
The YoY change in the median price peaked at 25.2% in May 2021 and has now slowed to 7.7%. The YoY increase in August was smaller than in July (9.5%) and suggests the Case-Shiller index will slow sharply soon. Note that the median price usually starts falling seasonally in July, so the 2.4% decline from July to August in the median price was partially seasonal (but the decline over the last two months has been much larger than the usual decline).

NAR: Existing-Home Sales Decreased to 4.80 million SAAR in August
by Calculated Risk on 9/21/2022 10:13:00 AM
From the NAR: Existing-Home Sales Slipped 0.4% in August
Existing-home sales experienced a slight dip in August, marking the seventh consecutive month of declines, according to the National Association of REALTORS®. Month-over-month sales varied across the four major U.S. regions as two regions recorded increases, one was unchanged and the other posted a drop. On a year-over-year basis, however, sales fell in all regions.
Total existing-home sales, completed transactions that include single-family homes, townhomes, condominiums and co-ops, notched a minor contraction of 0.4% from July to a seasonally adjusted annual rate of 4.80 million in August. Year-over-year, sales faded by 19.9% (5.99 million in August 2021).
...
Total housing inventory registered at the end of August was 1,280,000 units, a decrease of 1.5% from July and unchanged from the previous year. Unsold inventory sits at a 3.2-month supply at the current sales pace – identical to July and up from 2.6 months in August 2021.
emphasis added
 Click on graph for larger image.
This graph shows existing home sales, on a Seasonally Adjusted Annual Rate (SAAR) basis since 1993.
Sales in August (4.80 million SAAR) were down 0.4% from the previous month and were 19.9% below the August 2021 sales rate.
The second graph shows nationwide inventory for existing homes.
 According to the NAR, inventory decreased to 1.28 million in August from 1.30 million in July.
Headline inventory is not seasonally adjusted, and inventory usually decreases to the seasonal lows in December and January, and peaks in mid-to-late summer.
The last graph shows the year-over-year (YoY) change in reported existing home inventory and months-of-supply. Since inventory is not seasonally adjusted, it really helps to look at the YoY change. Note: Months-of-supply is based on the seasonally adjusted sales and not seasonally adjusted inventory.
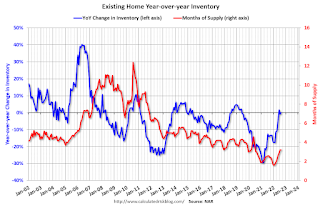 Inventory was unchanged year-over-year (blue) in August compared to August 2021.
Months of supply (red) was unchanged at 3.2 months in August from 3.2 months in July.
This was above the consensus forecast. I'll have more later.
The last graph shows the year-over-year (YoY) change in reported existing home inventory and months-of-supply. Since inventory is not seasonally adjusted, it really helps to look at the YoY change. Note: Months-of-supply is based on the seasonally adjusted sales and not seasonally adjusted inventory.
 Inventory was unchanged year-over-year (blue) in August compared to August 2021.
 Months of supply (red) was unchanged at 3.2 months in August from 3.2 months in July.
This was above the consensus forecast. I'll have more later.


