 RSS Feed
 by Calculated Risk on 8/02/2022 12:46:00 PM
Tuesday, August 02, 2022
Will 5% Mortgage Rates Cushion the Housing Market?
Today, in the Calculated Risk Real Estate Newsletter: Will 5% Mortgage Rates Cushion the Housing Market?
A brief excerpt:
The following graph shows the year-over-year change in principal & interest (P&I) assuming a fixed loan amount since 1977. Currently P&I is up about 30% year-over-year for a fixed amount (this doesn’t take into account the change in house prices).There is much more in the article. You can subscribe at https://calculatedrisk.substack.com/
This is less than the 35% year-over-year increase average in June, but still up sharply.
If we include the increase in house prices, payments are up more than 50% year-over-year on the same home.
The bottom-line is the recent decline in mortgage rates will help at the margin, but the housing market will remain under pressure with mortgage rates at 5% (fewer sales, slowing house price growth).

NY Fed Q2 Report: Total Household Debt Surpasses $16 trillion
by Calculated Risk on 8/02/2022 11:11:00 AM
From the NY Fed: Total Household Debt Surpasses $16 trillion in Q2 2022; Mortgage, Auto Loan, and Credit Card Balances Increase
The Federal Reserve Bank of New York's Center for Microeconomic Data today issued its Quarterly Report on Household Debt and Credit. The Report shows an increase in total household debt in the second quarter of 2022, increasing by $312 billion (2%) to $16.15 trillion. Balances now stand $2 trillion higher than at the end of 2019, before the COVID-19 pandemic. The report is based on data from the New York Fed's nationally representative Consumer Credit Panel.
Mortgage balances rose by $207 billion in the second quarter of 2022 and stood at $11.39 trillion at the end of June. Credit card balances also increased by $46 billion. Although seasonal patterns typically include an increase in the second quarter, the 13% cumulative increase in credit card balances since Q2 2021 represents the largest in more than 20 years. Auto loan balances increased by a solid $33 billion in the second quarter, while student loan balances were roughly unchanged from the first quarter and stand at $1.59 trillion. Other balances–which includes retail cards and other consumer loans –increased by a robust $25 billion. In total, non-housing balances grew by $103 billion, the largest increase seen since 2016.
Mortgage originations slightly declined in the second quarter and stood at $758 billion. The volume of newly originated auto loans increased to $199 billion, continuing the high volumes seen in dollar terms since Q3 2020. Aggregate limits on credit card accounts increased by $100 billion and now stand at $4.22 trillion–the largest increase in more than ten years.
emphasis added
 Click on graph for larger image.
Here are three graphs from the report:
The first graph shows aggregate consumer debt increased in Q2. Household debt previously peaked in 2008 and bottomed in Q3 2013. Unlike following the great recession, there wasn't a huge decline in debt during the pandemic.
From the NY Fed:
Aggregate household debt balances increased by $312 billion in the second quarter of 2022, a 2.0% rise from 2022Q1. Balances now stand at $16.15 trillion and have increased by $2 trillion since the end of 2019, just before the pandemic recession.
 The second graph shows the percent of debt in delinquency.
The overall delinquency rate was unchanged in Q2. From the NY Fed:
Aggregate delinquency rates were unchanged again in the second quarter of 2022 and remain very low, after declining sharply through the beginning of the pandemic, although aggregate delinquency rates have seen some change in the composition. The share of balances that are severely derogatory has declined to 1.1%, although the decline has been offset by increases in balances that are 30 days late. As of June, 2.7% of outstanding debt was in some stage of delinquency, a 2.0 percentage point decrease from the first quarter of 2019, just before the COVID-19 pandemic hit the United States.There is much more in the report.
HVS: Q2 2022 Homeownership and Vacancy Rates
by Calculated Risk on 8/02/2022 10:26:00 AM
The Census Bureau released the Residential Vacancies and Homeownership report for Q2 2022.
The results of this survey were significantly distorted by the pandemic in 2020.
This report is frequently mentioned by analysts and the media to track household formation, the homeownership rate, and the homeowner and rental vacancy rates. However, there are serious questions about the accuracy of this survey.
This survey might show the trend, but I wouldn't rely on the absolute numbers. Analysts probably shouldn't use the HVS to estimate the excess vacant supply or household formation, or rely on the homeownership rate, except as a guide to the trend.
National vacancy rates in the second quarter 2022 were 5.6 percent for rental housing and 0.8 percent for homeowner housing. The rental vacancy rate was 0.6 percentage points lower than the rate in the second quarter 2021 (6.2 percent) and not statistically different from the rate in the first quarter 2022 (5.8 percent).
The homeowner vacancy rate of 0.8 percent was not statistically different from the rate in the second quarter 2021 (0.9 percent) and virtually the same as the rate in the first quarter 2022 (0.8 percent).
The homeownership rate of 65.8 percent was not statistically different from the rate in the second quarter 2021 (65.4 percent) and not statistically different from the rate in the first quarter 2022 (65.4 percent).
emphasis added
 Click on graph for larger image.
The Red dots are the decennial Census homeownership rates for April 1st, 1990, 2000 and 2010. The Census Bureau will release data for 2020 soon.
The HVS homeownership rate increased to 65.8% in Q2, from 65.4% in Q1.
The results in Q2 and Q3 2020 were distorted by the pandemic.
 The HVS homeowner vacancy was unchanged at 0.8% in Q2 from 0.8% in Q1.
 Once again - this probably shows the general trend, but I wouldn't rely on the absolute numbers.
 The rental vacancy rate decreased to 5.6% in Q2 from 5.8% in Q1.
 The HVS also has a series on asking rents. This surged following the early stages of the pandemic - like other measures - and is up 27% over the last two years. However, asking rents were only up 7% year-over-year in Q2 2022.
The quarterly HVS is the timeliest survey on households, but there are many questions about the accuracy of this survey.
BLS: Job Openings Decreased to 10.7 million in June
by Calculated Risk on 8/02/2022 10:07:00 AM
From the BLS: Job Openings and Labor Turnover Summary
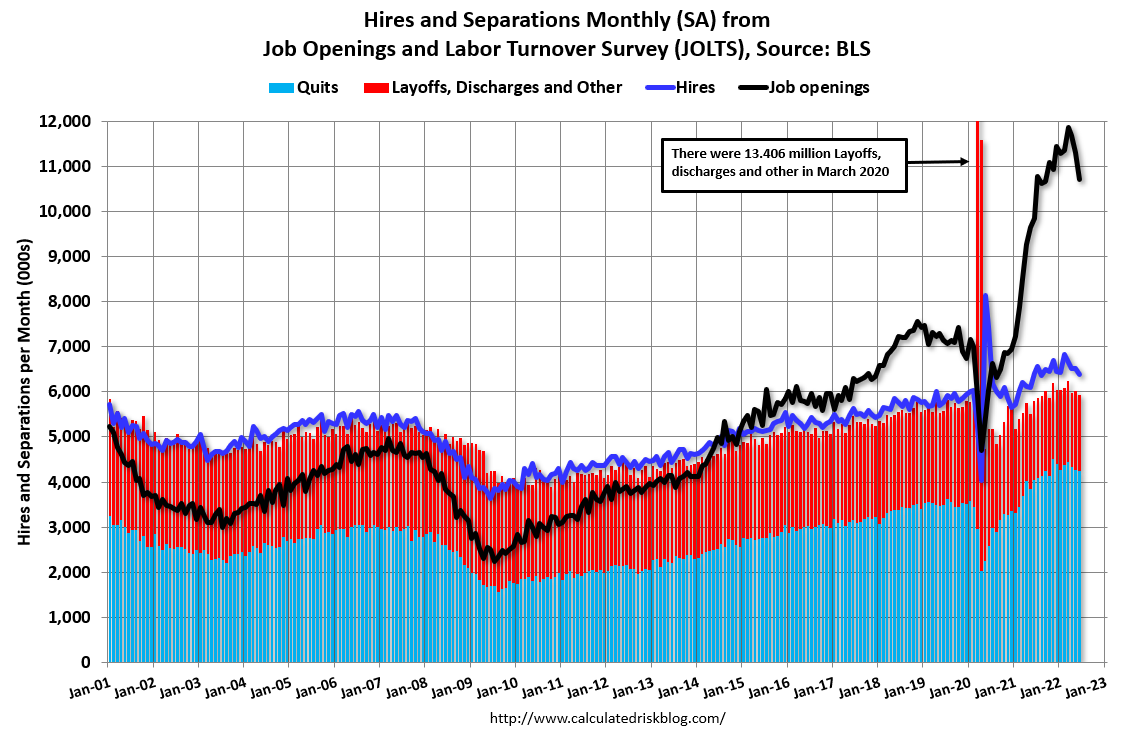
The number of job openings decreased to 10.7 million on the last business day of June, the U.S. Bureau of Labor Statistics reported today. Hires and total separations were little changed at 6.4 million and 5.9 million, respectively. Within separations, quits (4.2 million) and layoffs and discharges (1.3 million) were little changed.The following graph shows job openings (yellow line), hires (dark blue), Layoff, Discharges and other (red column), and Quits (light blue column) from the JOLTS.
emphasis added
This series started in December 2000.
Note: The difference between JOLTS hires and separations is similar to the CES (payroll survey) net jobs headline numbers. This report is for June, the employment report this Friday will be for July.
 Click on graph for larger image.
Note that hires (dark blue) and total separations (red and light blue columns stacked) are usually pretty close each month. This is a measure of labor market turnover. When the blue line is above the two stacked columns, the economy is adding net jobs - when it is below the columns, the economy is losing jobs.
The spike in layoffs and discharges in March 2020 is labeled, but off the chart to better show the usual data.
Jobs openings decreased in June to 10.698 million from 11.303 million in May.
The number of job openings (black) were up 9% year-over-year.
Quits were up 5% year-over-year. These are voluntary separations. (See light blue columns at bottom of graph for trend for "quits").
CoreLogic: House Prices up 18.3% YoY in June
by Calculated Risk on 8/02/2022 08:00:00 AM
Notes: This CoreLogic House Price Index report is for June. The recent Case-Shiller index release was for May. The CoreLogic HPI is a three-month weighted average and is not seasonally adjusted (NSA).
From CoreLogic: Annual US Home Price Gains Slow for the Second Consecutive Month, CoreLogic Reports
CoreLogic® ... today released the CoreLogic Home Price Index (HPI™) and HPI Forecast™ for June 2022.
Nationwide, home prices grew by 18.3% from June 2021, marking the 125th consecutive month of year-over-year increases. Though annual appreciation was still strong, it slowed from the previous month for the second consecutive month, reflecting reduced buyer demand in part due to higher mortgage rates and worries about a slowing economy. CoreLogic projects that year-over-year appreciation will drop to 4.3% by June 2023, bringing home price growth close to the long run average from 2010 to 2020.
“Signs of a broader slowdown in the housing market are evident, as home price growth decelerated for the second consecutive month,” said Selma Hepp, interim lead of the Office of the Chief Economist at CoreLogic. “This is in line with our previous expectations and given the notable cooling of buyer demand due to higher mortgage rates and the resulting increased cost of homeownership. Nevertheless, buyers remain interested, which is keeping the market competitive — particularly for attractive homes that are properly priced.”
...
U.S. home prices (including distressed sales) increased 18.3% year over year in June 2022, compared to June 2021. On a month-over-month basis, home prices increased by 0.6% compared to May 2022.
...
Annual U.S. home price gains are forecast to slow to 4.3% by June 2023.
emphasis added
Monday, August 01, 2022
Tuesday: Job Openings, Q2 Household Debt and Credit, Vehicle Sales
by Calculated Risk on 8/01/2022 09:01:00 PM
 From Matthew Graham at Mortgage News Daily: August Starts Strong Thanks to Weaker Econ Data
During the Fed's press conference last week, Powell reiterated what we thought we already knew about Fed policy and the bond market in general. Specifically, the next big-picture shift will be data dependent. In several ways, that narrative already began playing out in July. Now August is kicking things off in the same vein with a big drop in manufacturing inflation (via ISM's "prices paid" component) this morning. Bonds rallied after that to end the day at the best levels in months. [30 year fixed 5.05%]Tuesday:
emphasis added
• At 8:00 AM ET: Corelogic House Price index for June.
• At 10:00 AM ET: Job Openings and Labor Turnover Survey for June from the BLS.
• At 10:00 AM: the Q2 2022 Housing Vacancies and Homeownership from the Census Bureau.
• At 11:00 AM: NY Fed: Q2 Quarterly Report on Household Debt and Credit
• All Day: Light vehicle sales for July from the BEA. The consensus is for light vehicle sales to be 13.5 million SAAR in July, up from 13.0 million in June (Seasonally Adjusted Annual Rate).
On COVID (focus on hospitalizations and deaths):
Hospitalizations have almost quadrupled from the lows in April 2022.
 Click on graph for larger image.
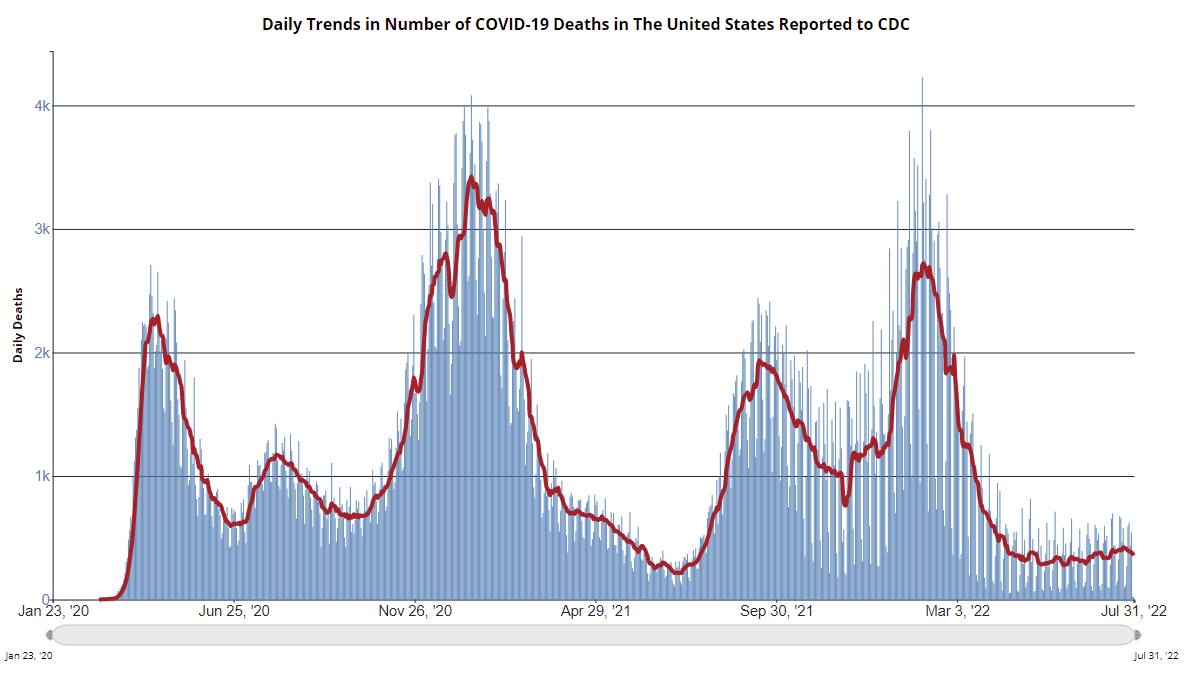
This graph shows the daily (columns) and 7-day average (line) of deaths reported.
| COVID Metrics | ||||
|---|---|---|---|---|
| Now | Week Ago | Goal | ||
| New Cases per Day2 | 114,021 | 127,727 | ≤5,0001 | |
| Hospitalized2 | 34,366 | 36,781 | ≤3,0001 | |
| Deaths per Day2 | 357 | 415 | ≤501 | |
| 1my goals to stop daily posts, 27-day average for Cases, Currently Hospitalized, and Deaths 🚩 Increasing 7-day average week-over-week for Cases, Hospitalized, and Deaths ✅ Goal met. | ||||
 Click on graph for larger image.
This graph shows the daily (columns) and 7-day average (line) of deaths reported.
Average daily deaths bottomed in July 2021 at 214 per day.
Construction Spending Decreased 1.1% in June
by Calculated Risk on 8/01/2022 12:39:00 PM
From the Census Bureau reported that overall construction spending increased:
Construction spending during June 2022 was estimated at a seasonally adjusted annual rate of $1,762.3 billion, 1.1 percent below the revised May estimate of $1,781.9 billion. The June figure is 8.3 percent above the June 2021 estimate of $1,628.0 billion.Both private and public spending decreased:
emphasis added
Spending on private construction was at a seasonally adjusted annual rate of $1,416.4 billion, 1.3 percent below the revised May estimate of $1,434.4 billion. ...
In June, the estimated seasonally adjusted annual rate of public construction spending was $345.9 billion, 0.5 percent below the revised May estimate of $347.5 billion.
 Click on graph for larger image.
This graph shows private residential and nonresidential construction spending, and public spending, since 1993. Note: nominal dollars, not inflation adjusted.
Residential (red) spending is 36% above the bubble peak (in nominal terms - not adjusted for inflation).
Non-residential (blue) spending is 19% above the bubble era peak in January 2008 (nominal dollars).
Public construction spending is 6% above the peak in March 2009.
 The second graph shows the year-over-year change in construction spending.
On a year-over-year basis, private residential construction spending is up 15.5%. Non-residential spending is up 1.7% year-over-year. Public spending is up 0.4% year-over-year.
This was below consensus expectations of a 0.2% increase in spending; however, construction spending for the previous three months combined was revised up slightly.
ISM® Manufacturing index Decreased to 52.8% in July
by Calculated Risk on 8/01/2022 12:14:00 PM
(Posted with permission). The ISM manufacturing index indicated expansion. The PMI® was at 52.8% in July, down from 53.0% in June. The employment index was at 49.9%, up from 47.3% last month, and the new orders index was at 48.0%, down from 49.2%.
From ISM: Manufacturing PMI® at 52.8% July 2022 Manufacturing ISM® Report On Business®
Economic activity in the manufacturing sector grew in July, with the overall economy achieving a 26th consecutive month of growth, say the nation's supply executives in the latest Manufacturing ISM® Report On Business®.This suggests manufacturing expanded at a slower pace in July than in June. This was above the consensus forecast, however the employment index was weak again in July.
The report was issued today by Timothy R. Fiore, CPSM, C.P.M., Chair of the Institute for Supply Management® (ISM®) Manufacturing Business Survey Committee:
“The July Manufacturing PMI® registered 52.8 percent, down 0.2 percentage point from the reading of 53 percent in June. This figure indicates expansion in the overall economy for the 26th month in a row after a contraction in April and May 2020. This is the lowest Manufacturing PMI® figure since June 2020, when it registered 52.4 percent. The New Orders Index registered 48 percent, 1.2 percentage points lower than the 49.2 percent recorded in June. The Production Index reading of 53.5 percent is a 1.4-percentage point decrease compared to June’s figure of 54.9 percent. The Prices Index registered 60 percent, down 18.5 percentage points compared to the June figure of 78.5 percent; this is the index’s lowest reading since August 2020 (59.5 percent). The Backlog of Orders Index registered 51.3 percent, 1.9 percentage points below the June reading of 53.2 percent. The Employment Index contracted for a third straight month at 49.9 percent, 2.6 percentage points higher than the 47.3 percent recorded in June. The Supplier Deliveries Index reading of 55.2 percent is 2.1 percentage points lower than the June figure of 57.3 percent. The Inventories Index registered 57.3 percent, 1.3 percentage points higher than the June reading of 56 percent. The New Export Orders Index reading of 52.6 percent is up 1.9 percentage points compared to June’s figure of 50.7 percent. The Imports Index grew again in July, up 3.7 percentage points to 54.4 percent from 50.7 percent in June.”
emphasis added
Black Knight Mortgage Monitor: "Record-Setting Slowdown in Home Price Growth"
by Calculated Risk on 8/01/2022 10:33:00 AM
Today, in the Calculated Risk Real Estate Newsletter: Black Knight Mortgage Monitor: "Record-Setting Slowdown in Home Price Growth"
A brief excerpt:
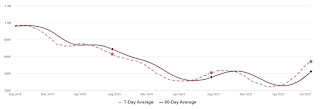
The first graph shows Black Knight’s estimate of monthly house price increases and the year-over-year change in prices.There is much more in the article. You can subscribe at https://calculatedrisk.substack.com/
• The annual home price growth rate fell by nearly two full percentage points to 17.3% in June, from 19.3% in the prior month – a 66% stronger deceleration than in the prior month
• June's slowdown surpassed by 50% the 134 BPS plunge precipitated by Volcker-era rate hikes in the early 1980s and was the most significant drop since at least the early 1970s
• Even after hitting the brakes historically in June, it would take six more months of equivalent slowing to bring the annual growth rate down to 5%, more in line with the long-term average

Housing Inventory August 1st Update: Up 32.3% Year-over-year
by Calculated Risk on 8/01/2022 10:14:00 AM
Inventory is still increasing rapidly, but the inventory build has slowed somewhat over the last few weeks. Still, inventory is increasing much faster than normal for this time of year (both in percentage terms and in total inventory added). Here are the same week inventory changes for the last four years:
2022: 13.4K
2021: 4.4K
2020: -13.4K
2019: 2.9K
Inventory bottomed seasonally at the beginning of March 2022 and is now up 124% since then. More than double! Altos reports inventory is up 32.3% year-over-year and is now 23.2% above the peak last year.
 Click on graph for larger image.
This inventory graph is courtesy of Altos Research.
 Click on graph for larger image.
This inventory graph is courtesy of Altos Research.
As of July 29th, inventory was at 539 thousand (7-day average), compared to 526 thousand the prior week. Inventory was up 2.5% from the previous week.
Inventory is still historically low. Compared to the same week in 2021, inventory is up 32.3% from 407 thousand, however compared to the same week in 2020 inventory is down 14.0% from 627 thousand. Compared to 3 years ago, inventory is down 44.6% from 972 thousand.
Here are the inventory milestones I’m watching for with the Altos data:
1. The seasonal bottom (happened on March 4th for Altos) ✅
2. Inventory up year-over-year (happened on May 13th for Altos) ✅
3. Inventory up compared to two years ago (currently down 14.0% according to Altos)
4. Inventory up compared to 2019 (currently down 44.6%).
1. The seasonal bottom (happened on March 4th for Altos) ✅
2. Inventory up year-over-year (happened on May 13th for Altos) ✅
3. Inventory up compared to two years ago (currently down 14.0% according to Altos)
4. Inventory up compared to 2019 (currently down 44.6%).

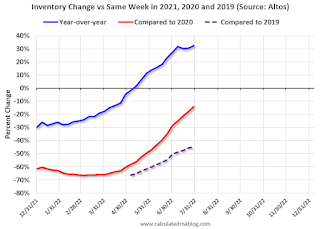
Here is a graph of the inventory change vs 2021, 2020 (milestone 3 above) and 2019 (milestone 4).
The blue line is the year-over-year data, the red line is compared to two years ago, and dashed purple is compared to 2019.
Two years ago (in 2020) inventory was declining all year, so the two-year comparison will get easier all year.
Based on the recent increases in inventory, my current estimate is inventory will be up compared to 2020 in late August or early September of this year, and back to 2019 levels in early 2023.
Mike Simonsen discusses this data regularly on Youtube.


