 RSS Feed
 by Calculated Risk on 7/11/2022 08:30:00 AM
Monday, July 11, 2022
Five High Frequency Indicators for the Economy
These indicators are mostly for travel and entertainment. It is interesting to watch these sectors recover as the pandemic subsides. Notes: I've added back gasoline supplied to see if there is an impact from higher gasoline prices. Apple has discontinued "Apple mobility", and restaurant traffic is mostly back to normal.
The TSA is providing daily travel numbers.
This data is as of July 10th.
 Click on graph for larger image.
This data shows the 7-day average of daily total traveler throughput from the TSA for 2019 (Light Blue), 2020 (Black), 2021 (Blue) and 2022 (Red).
The dashed line is the percent of 2019 for the seven-day average.
The 7-day average is down 14.4% from the same day in 2019 (85.6% of 2019). (Dashed line)
Air travel - as a percent of 2019 - has been moving sideways over the last several months, off about 10% from 2019 - with some ups and downs, usually related to timing of holidays.
 This data shows domestic box office for each week and the median for the years 2016 through 2019 (dashed light blue).
 Black is 2020, Blue is 2021 and Red is 2022.
The data is from BoxOfficeMojo through July 7th.
Note that the data is usually noisy week-to-week and depends on when blockbusters are released.
Movie ticket sales were at $206 million last week, down about 39% from the median for the week.
Note that the data is usually noisy week-to-week and depends on when blockbusters are released.
Movie ticket sales were at $206 million last week, down about 39% from the median for the week.
 This graph shows the seasonal pattern for the hotel occupancy rate using the four-week average.
 The red line is for 2022, black is 2020, blue is the median, and dashed light blue is for 2021. Dashed purple is 2019 (STR is comparing to a strong year for hotels).
This data is through July 2nd. The occupancy rate was up 2.9% compared to the same week in 2019.
The 4-week average of the occupancy rate is at the median rate for the previous 20 years (Blue).
Notes: Y-axis doesn't start at zero to better show the seasonal change.
Notes: Y-axis doesn't start at zero to better show the seasonal change.
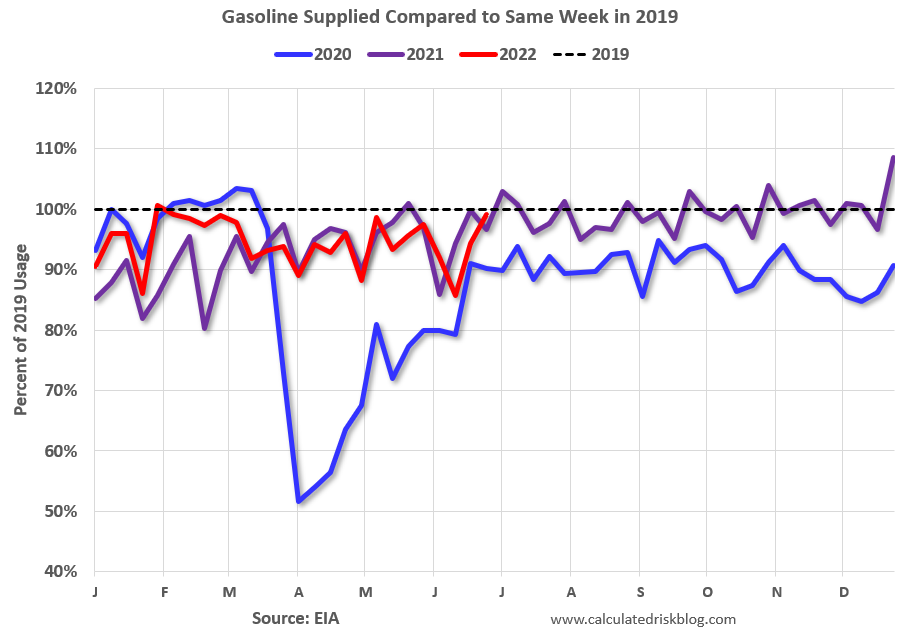
This graph, based on weekly data from the U.S. Energy Information Administration (EIA), shows gasoline supplied compared to the same week of 2019.
Blue is for 2020. Purple is for 2021, and Red is for 2022.
As of July 1st, gasoline supplied was down 0.8% compared to the same week in 2019.
Recently gasoline supplied has been running somewhat below 2019 levels.
Here is some interesting data on New York subway usage (HT BR).
 This graph is from Todd W Schneider.
 This graph shows weekly turnstile entries since 2015.
Currently traffic is less than half of normal.
Currently traffic is less than half of normal.
This data is through Friday, July 8th.
He notes: "Data updates weekly from the MTA’s public turnstile data, usually on Saturday mornings".
Sunday, July 10, 2022
Sunday Night Futures
by Calculated Risk on 7/10/2022 08:19:00 PM
Weekend:
• Schedule for Week of July 10, 2022
Monday:
• No major economic releases scheduled.
From CNBC: Pre-Market Data and Bloomberg futures S&P 500 and DOW futures are down slightly (fair value).
Oil prices were down over the last week with WTI futures at $104.79 per barrel and Brent at $107.02 per barrel. A year ago, WTI was at $75, and Brent was at $77 - so WTI oil prices are up 40% year-over-year.
Here is a graph from Gasbuddy.com for nationwide gasoline prices. Nationally prices are at $4.67 per gallon. A year ago, prices were at $3.12 per gallon, so gasoline prices are up $1.55 per gallon year-over-year.
Hotels: Occupancy Rate Up 2.9% Compared to Same Week in 2019
by Calculated Risk on 7/10/2022 08:11:00 AM
From CoStar: STR: US Hotel Performance Dips Ahead of Independence Day but Outpaces Pre-Pandemic Levels
U.S. hotel performance dipped from the previous week, while indexed comparisons against 2019 improved on the favorable side of a holiday calendar shift, according to STR‘s latest data through July 2.The following graph shows the seasonal pattern for the hotel occupancy rate using the four-week average.
June 26 to July 2, 2022 (percentage change from comparable week in 2019*):
• Occupancy: 67.3% (+2.9%)
• Average daily rate (ADR): $153.32 (+19.7%)
• Revenue per available room (RevPAR): $103.24 (+23.1%)
Given historical trends, the week-over-week decline in demand was normal given the holiday. Since 2000, the Fourth of July or the observance of the holiday (federal holiday) has fallen on a Monday seven times, including last year and in 2016. In every case, occupancy in the week before the holiday fell by more than four percentage points with most of the losses beginning on Wednesday and continuing into the weekend. Occupancy and demand are likely to fall again for this current week before strengthening in the remaining weeks of July.
*Due to the pandemic impact, STR is measuring recovery against comparable time periods from 2019.
emphasis added
Click on graph for larger image.The red line is for 2022, black is 2020, blue is the median, and dashed light blue is for 2021. Dashed purple is 2019 (STR is comparing to a strong year for hotels).
The 4-week average of the occupancy rate is at the median rate for the previous 20 years (Blue).
Note: Y-axis doesn't start at zero to better show the seasonal change.
The 4-week average of the occupancy rate will increase seasonally over the next couple of months.
Saturday, July 09, 2022
Real Estate Newsletter Articles this Week
by Calculated Risk on 7/09/2022 02:11:00 PM
At the Calculated Risk Real Estate Newsletter this week:
• House Price Declines: How Long for Real Prices to Recover?
• 30-Year Mortgage Rates Decrease to 5.50%
• Black Knight Mortgage Monitor: "Early signs of cooling in the housing market"
• 1st Look at Local Housing Markets in June
• Apartment Vacancy Rate Declined in Q2
This is usually published 4 to 6 times a week and provides more in-depth analysis of the housing market.
You can subscribe at https://calculatedrisk.substack.com/
Most content is available for free (and no Ads), but please subscribe!
AAR: June Rail Carloads and Intermodal Down Year-over-year
by Calculated Risk on 7/09/2022 08:11:00 AM
From the Association of American Railroads (AAR) Rail Time Indicators. Graphs and excerpts reprinted with permission.
In June, total U.S. carloads fell 1.5% from last year, their third consecutive monthly decline. ...
U.S intermodal originations in June were down 4.6% from last year, their fifth decline in 2022’s first six months.
emphasis added
 Click on graph for larger image.
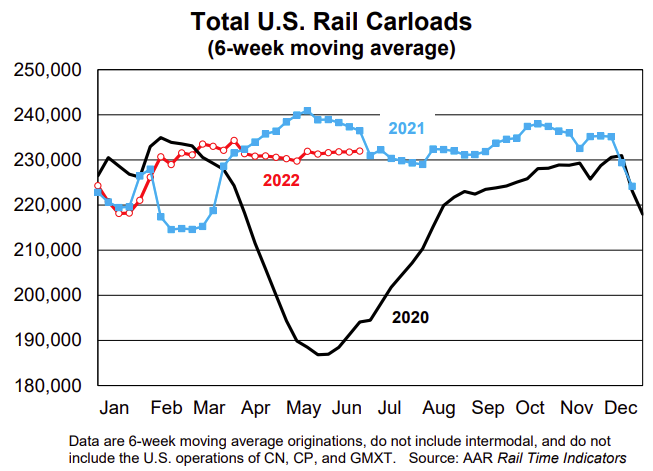
This graph from the Rail Time Indicators report shows the six-week average of U.S. Carloads in 2020, 2021 and 2022:
U.S. railroads originated 1.16 million total carloads in June 2022, down 1.5% from June 2021. It’s the third consecutive year-over-year decline and the fourth in the first six months of 2022. In 2022’s second quarter, total carloads were down 2.7% from last year; in the first half, they were down 0.1%. Since 1988, when our data begin, only 2020 had fewer first-half carloads than 2022.
 The second graph shows the six-week average (not monthly) of U.S. intermodal in 2020, 2021 and 2022: (using intermodal or shipping containers):
U.S railroads also originated 1.32 million intermodal units in June, down 4.6% from last year. It’s the fifth decline in 2022’s first six months and the 10th in the past 11 months. Intermodal originations averaged 264,624 per week in June 2022, the fewest in four months.
Schedule for Week of July 10, 2022
by Calculated Risk on 7/09/2022 08:11:00 AM
The key reports this week are June CPI and retail sales.
For manufacturing, the June Industrial Production report and the July New York Fed manufacturing survey will be released.
No major economic releases scheduled.
6:00 AM ET: NFIB Small Business Optimism Index for June.
7:00 AM ET: The Mortgage Bankers Association (MBA) will release the results for the mortgage purchase applications index.
8:30 AM: The Consumer Price Index for June from the BLS. The consensus is for a 1.1% increase in CPI, and a 0.6% increase in core CPI. The consensus is for CPI to be up 8.8% year-over-year and core CPI to be up 5.8% YoY.
2:00 PM: the Federal Reserve Beige Book, an informal review by the Federal Reserve Banks of current economic conditions in their Districts.
8:30 AM: The initial weekly unemployment claims report will be released. The consensus is for 230 thousand down from 235 thousand last week.
8:30 AM: The Producer Price Index for June from the BLS. The consensus is for a 0.8% increase in PPI, and a 0.5% increase in core PPI.
 8:30 AM: Retail sales for June is scheduled to be released. The consensus is for 0.8% increase in retail sales.
This graph shows retail sales since 1992. This is monthly retail sales and food service, seasonally adjusted (total and ex-gasoline).
Retail sales ex-gasoline were down 0.3% in May.
8:30 AM: The New York Fed Empire State manufacturing survey for July. The consensus is for a reading of -2.6, down from -1.2.
 9:15 AM: The Fed will release Industrial Production and Capacity Utilization for June.
This graph shows industrial production since 1967.
The consensus is for a no change in Industrial Production, and for Capacity Utilization to decrease to 80.4%.
10:00 AM: University of Michigan's Consumer sentiment index (Preliminary for July).
Friday, July 08, 2022
COVID July 8, 2022, Update on Cases, Hospitalizations and Deaths
by Calculated Risk on 7/08/2022 09:27:00 PM
On COVID (focus on hospitalizations and deaths):
| COVID Metrics | ||||
|---|---|---|---|---|
| Now | Week Ago | Goal | ||
| Percent fully Vaccinated | 67.0% | --- | ≥70.0%1 | |
| Fully Vaccinated (millions) | 222.5 | --- | ≥2321 | |
| New Cases per Day3 | 106,021 | 112,330 | ≤5,0002 | |
| Hospitalized3🚩 | 29,327 | 27,322 | ≤3,0002 | |
| Deaths per Day3 | 277 | 341 | ≤502 | |
| 1 Minimum to achieve "herd immunity" (estimated between 70% and 85%). 2my goals to stop daily posts, 37-day average for Cases, Currently Hospitalized, and Deaths 🚩 Increasing 7-day average week-over-week for Cases, Hospitalized, and Deaths ✅ Goal met. | ||||
 Click on graph for larger image.
This graph shows the daily (columns) and 7-day average (line) of deaths reported.
Average daily deaths bottomed in July 2021 at 214 per day.
Used Vehicle Wholesale Prices Decreased 1.3% in June
by Calculated Risk on 7/08/2022 03:23:00 PM
From Manheim Consulting today: Wholesale Used-Vehicle Prices Decrease in June from Seasonal Adjustment
Wholesale used-vehicle prices (on a mix-, mileage-, and seasonally adjusted basis) decreased 1.3% in June from May. The Manheim Used Vehicle Value Index declined to 219.9, up 9.7% from a year ago. The non-adjusted price change in June decreased 1.8% compared to May, leaving the unadjusted average price up 10.7% year over year.
In June, Manheim Market Report (MMR) values saw larger declines over the last two weeks than the prior two weeks.
emphasis added
 Click on graph for larger image.
This index from Manheim Consulting is based on all completed sales transactions at Manheim’s U.S. auctions.
The Manheim index suggests used car prices decreased in June and are up 9.7% year-over-year (YoY).
The YoY change is mostly getting smaller. This index was up 45% YoY in January, and now up less than 10% YoY.
Apartment Vacancy Rate Declined in Q2
by Calculated Risk on 7/08/2022 01:25:00 PM
Today, in the Calculated Risk Real Estate Newsletter: Apartment Vacancy Rate Declined in Q2
A brief excerpt:
Moody’s Analytics Reis reported that the apartment vacancy rate was at 4.5% in Q2 2022, down from 4.7% in Q1, and down from a pandemic peak of 5.4% in both Q1 and Q2 2021.There is more in the article. You can subscribe at https://calculatedrisk.substack.com/
...
This graph shows the apartment vacancy rate starting in 1980. (Annual rate before 1999, quarterly starting in 1999). Note: Moody’s Analytics is just for large cities. ...
Click on graph for larger image.
Moody’s Analytics also reported the effective rents were up 2.8% in Q2 from Q1, and up 17.5% year-over-year. Last week, I posted a graph of the year-over-year change for various measures of rent. The Zillow measure is up 15.9% YoY in May, down from 16.6% YoY in April. This is down from a peak of 17.2% YoY in February. The ApartmentList measure is up 14.1% YoY as of June, down from 15.4% in May. This is down from the peak of 17.8% YoY last December.

Q2 GDP Forecasts: Slightly Negative
by Calculated Risk on 7/08/2022 12:22:00 PM
Note: We've seen two consecutive quarters of negative GDP before without a recession (that isn't the definition). If Q2 is negative, it will mostly be due to inventory and trade issues. No worries. My view is the US economy is not currently in a recession, see: Predicting the Next Recession
From BofA:
We are now tracking -1.2% qoq saar growth for 2Q, down from 0.0% qoq saar previously.From Goldman:
It is reasonable to dismiss some of the signal from the GDP declines that may have taken place in the first two quarters of the year on account of the large negative contributions from net trade and inventories. In addition, there is a larger-than-normal gap between GDP and GDI which, historically, has been resolved by GDP getting revised toward GDI, suggesting that some of the as-reported weakness in activity may get revised away over time. [July 8 estimate]
emphasis added
We left our Q2 GDP tracking estimate unchanged at +0.7% (qoq ar). [July 8 estimate]And from the Altanta Fed: GDPNow
The GDPNow model estimate for real GDP growth (seasonally adjusted annual rate) in the second quarter of 2022 is -1.2 percent on July 8, up from -1.9 percent on July 7. [July 8 estimate]


