 RSS Feed
 by Calculated Risk on 6/22/2022 08:13:00 PM
Wednesday, June 22, 2022
Thursday: Unemployment Claims, Fed Chair Powell Testimony, Bank Stress Tests
 Thursday:
• At 8:30 AM ET, The initial weekly unemployment claims report will be released. The consensus is for 225 thousand down from 229 thousand last week.
• At 10:00 AM, Testimony, Fed Chair Jerome Powell, Semiannual Monetary Policy Report to Congress, Before the Committee on Financial Services, U.S. House of Representatives
• At 4:30 PM, The Fed will release the annual Bank Stress Tests results.
On COVID (focus on hospitalizations and deaths):
| COVID Metrics | ||||
|---|---|---|---|---|
| Now | Week Ago | Goal | ||
| Percent fully Vaccinated | 66.8% | --- | ≥70.0%1 | |
| Fully Vaccinated (millions) | 221.9 | --- | ≥2321 | |
| New Cases per Day3 | 99,365 | 103,646 | ≤5,0002 | |
| Hospitalized3🚩 | 24,470 | 24,213 | ≤3,0002 | |
| Deaths per Day3 | 248 | 295 | ≤502 | |
| 1 Minimum to achieve "herd immunity" (estimated between 70% and 85%). 2my goals to stop daily posts, 37-day average for Cases, Currently Hospitalized, and Deaths 🚩 Increasing 7-day average week-over-week for Cases, Hospitalized, and Deaths ✅ Goal met. | ||||
 Click on graph for larger image.
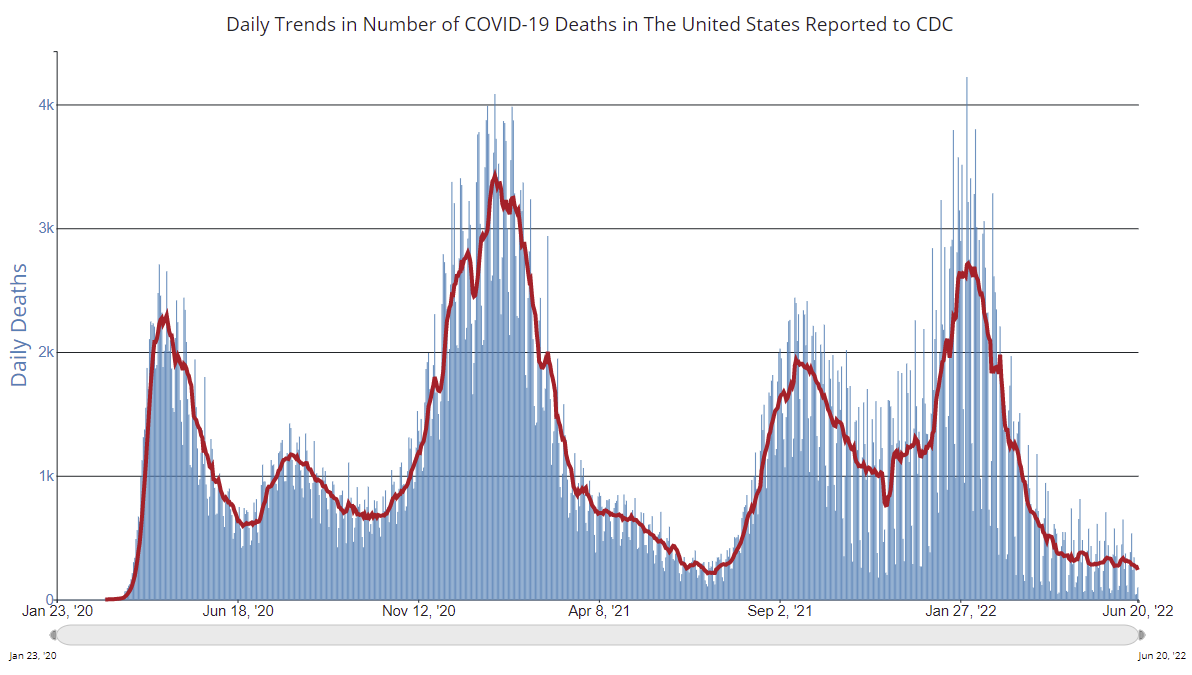
This graph shows the daily (columns) and 7-day average (line) of deaths reported.
Average daily deaths bottomed in July 2021 at 214 per day.
AIA: "Architecture Billings Index slows but remains strong" in May
by Calculated Risk on 6/22/2022 03:01:00 PM
Note: This index is a leading indicator primarily for new Commercial Real Estate (CRE) investment.
From the AIA: Architecture Billings Index slows but remains strong
Architecture firms reported increasing demand for design services in May, according to a new report today from The American Institute of Architects (AIA).
The ABI score for May was 53.5. While this score is down from April’s score of 56.5, it still indicates very strong business conditions overall (any score above 50 indicates an increase in billings from the prior month). Also in May, both the new project inquiries and design contracts indexes expanded, posting scores of 63.9 and 56.9 respectively.
“The strength in design activity over the past three months has produced a broader base of gains. The Northeast region and Institutional sector have struggled with slow billings activity, but now have posted consecutive months of positive scores.” said AIA Chief Economist, Kermit Baker, Hon. AIA, PhD. “With the improvement in inquiries and new design projects, demand for design services will likely remain high for the next several months, despite strong economic headwinds.”
...
• Regional averages: West (59.3); Midwest (56.8); South (52.3); Northeast (51.4)
• Sector index breakdown: commercial/industrial (57.7); mixed practice (56.2); multi-family residential (54.5); institutional (51.7)
emphasis added
 Click on graph for larger image.
This graph shows the Architecture Billings Index since 1996. The index was at 53.5 in May, down from 56.5 in April. Anything above 50 indicates expansion in demand for architects' services.
Note: This includes commercial and industrial facilities like hotels and office buildings, multi-family residential, as well as schools, hospitals and other institutions.
This index has been positive for sixteen consecutive months. This index usually leads CRE investment by 9 to 12 months, so this index suggests a pickup in CRE investment in 2022 and into 2023.
Final Look at Local Housing Markets in May, Inventory Up, Sales Down, New Listings Picking Up
by Calculated Risk on 6/22/2022 12:03:00 PM
Today, in the Calculated Risk Real Estate Newsletter: Final Look at Local Housing Markets in May
A brief excerpt:
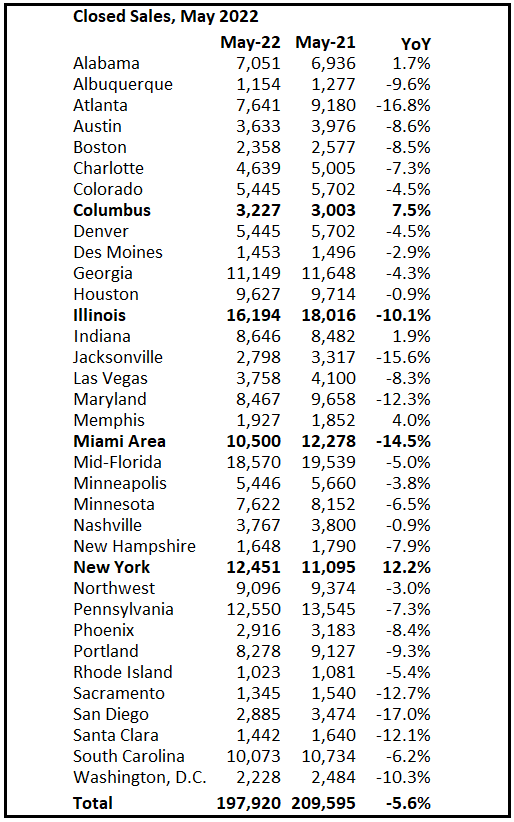
This is the final look at local markets in May. I’m tracking about 35 local housing markets in the US. Some of the 35 markets are states, and some are metropolitan areas. I update these tables throughout each month as additional data is released.There is much more in the article. You can subscribe at https://calculatedrisk.substack.com/
We are seeing a significant change in inventory, and maybe a pickup in new listings. So far, most of the increase in inventory has been due to softer demand - likely because of higher mortgage rates - but we need to keep an eye on new listings too.
...
And a table of May sales. Sales in these areas were down 5.6% YoY, Not Seasonally Adjusted (NSA). The NAR reported sales NSA in May (498,000) were 5.7% below sales in May 2021 (528,000). So, this sample of local markets is similar to the NAR report.
The table doesn’t include California where sales were down 15.2% year-over-year.
Fed Chair Powell: Semiannual Monetary Policy Report to the Congress
by Calculated Risk on 6/22/2022 09:33:00 AM
This testimony will be live here at 9:30 AM ET.
Report here.
From Fed Chair Powell: Semiannual Monetary Policy Report to the Congress. An excerpt on inflation:
I will begin with one overarching message. At the Fed, we understand the hardship high inflation is causing. We are strongly committed to bringing inflation back down, and we are moving expeditiously to do so. We have both the tools we need and the resolve it will take to restore price stability on behalf of American families and businesses. It is essential that we bring inflation down if we are to have a sustained period of strong labor market conditions that benefit all.
...
Over coming months, we will be looking for compelling evidence that inflation is moving down, consistent with inflation returning to 2 percent. We anticipate that ongoing rate increases will be appropriate; the pace of those changes will continue to depend on the incoming data and the evolving outlook for the economy. We will make our decisions meeting by meeting, and we will continue to communicate our thinking as clearly as possible. Our overarching focus is using our tools to bring inflation back down to our 2 percent goal and to keep longer-term inflation expectations well anchored.
MBA: Mortgage Applications Increase in Latest Weekly Survey
by Calculated Risk on 6/22/2022 07:00:00 AM
From the MBA: Mortgage Applications Increase in Latest MBA Weekly Survey
Mortgage applications increased 4.2 percent from one week earlier, according to data from the Mortgage Bankers Association’s (MBA) Weekly Mortgage Applications Survey for the week ending June 17, 2022.
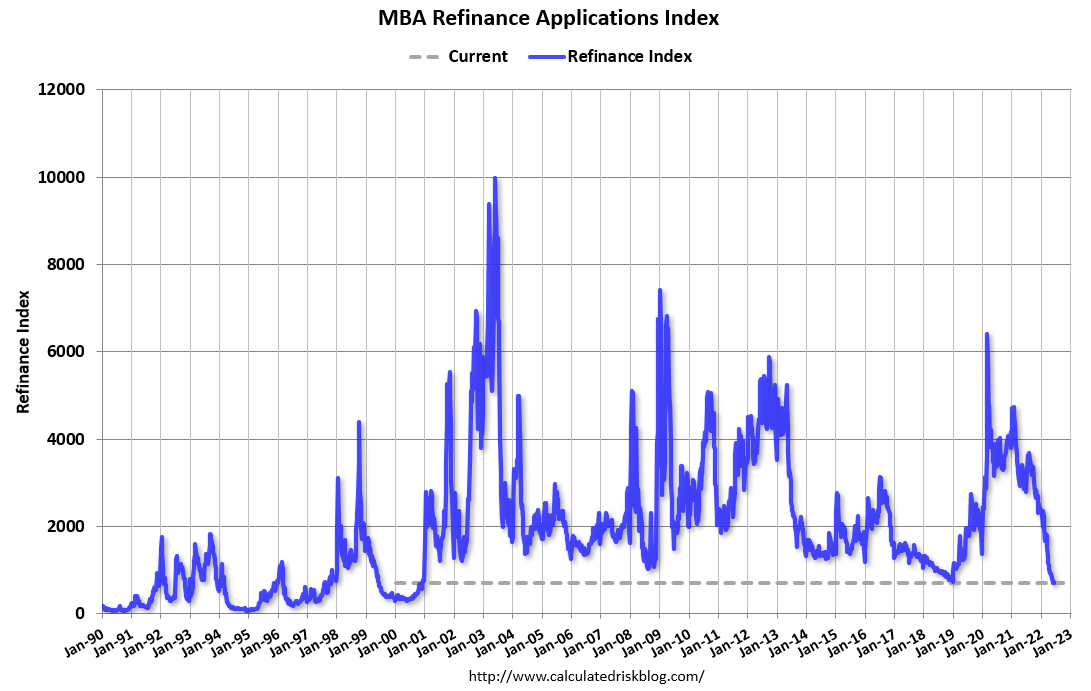
... The Refinance Index decreased 3 percent from the previous week and was 77 percent lower than the same week one year ago. The seasonally adjusted Purchase Index increased 8 percent from one week earlier. The unadjusted Purchase Index increased 6 percent compared with the previous week and was 10 percent lower than the same week one year ago.
“Mortgage rates continued to surge last week, with the 30-year fixed mortgage rate jumping 33 basis points to 5.98 percent – the highest since November 2008 and the largest single-week increase since 2009. All other loan types also increased by at least 20 basis points, influenced by the Federal Reserve’s 75-basis-point rate hike and commentary that more are coming to slow inflation,” said Joel Kan, MBA’s Associate Vice President of Economic and Industry Forecasting. “Mortgage rates are now almost double what they were a year ago, leading to a 77 percent drop in refinance volume over the past 12 months.”
Added Kan, “Purchase applications increased for the second straight week – driven mainly by conventional applications – and the ARM share of applications jumped back to over 10 percent. However, purchase activity was still 10 percent lower than a year ago, as inventory shortages and higher mortgage rates are dampening demand. The average loan size, at just over $420,000, is well below its $460,000 peak earlier this year and is potentially a sign that home price-growth is moderating.”
...
The average contract interest rate for 30-year fixed-rate mortgages with conforming loan balances ($647,200 or less) increased to 5.98 percent from 5.65 percent, with points increasing to 0.77 from 0.71 (including the origination fee) for 80 percent loan-to-value ratio (LTV) loans.
emphasis added
 Click on graph for larger image.
The first graph shows the refinance index since 1990.
With higher mortgage rates, the refinance index has declined sharply over the last several months.
The refinance index is just above the lowest level since the year 2000.
The second graph shows the MBA mortgage purchase index
 According to the MBA, purchase activity is down 10% year-over-year unadjusted.
Note: Red is a four-week average (blue is weekly).
Tuesday, June 21, 2022
Wednesday: Fed Chair Powell Testimony
by Calculated Risk on 6/21/2022 09:08:00 PM
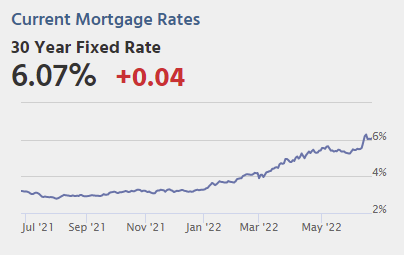 From Matthew Graham at Mortgage News Daily: Mortgage Rates Slightly Higher to Start The Week
Mortgage rates surged well into the 6% range last week before quickly cooling down after Wednesday's Fed announcement. The average top tier rate was nearly back below 6% by Friday. [30 year fixed 6.07%]Wednesday:
emphasis added
• At 7:00 AM ET, The Mortgage Bankers Association (MBA) will release the results for the mortgage purchase applications index.
• At 9:30 AM, Testimony, Fed Chair Jerome Powell, Semiannual Monetary Policy Report to Congress, Before the Committee on Banking, Housing, and Urban Affairs, U.S. Senate
During the day, The AIA's Architecture Billings Index for May (a leading indicator for commercial real estate).
On COVID (focus on hospitalizations and deaths):
| COVID Metrics | ||||
|---|---|---|---|---|
| Now | Week Ago | Goal | ||
| Percent fully Vaccinated | 66.8% | --- | ≥70.0%1 | |
| Fully Vaccinated (millions) | 221.9 | --- | ≥2321 | |
| New Cases per Day3 | 89,102 | 106,368 | ≤5,0002 | |
| Hospitalized3 | 23,992 | 24,066 | ≤3,0002 | |
| Deaths per Day3 | 239 | 307 | ≤502 | |
| 1 Minimum to achieve "herd immunity" (estimated between 70% and 85%). 2my goals to stop daily posts, 37-day average for Cases, Currently Hospitalized, and Deaths 🚩 Increasing 7-day average week-over-week for Cases, Hospitalized, and Deaths ✅ Goal met. | ||||
 Click on graph for larger image.
This graph shows the daily (columns) and 7-day average (line) of deaths reported.
Average daily deaths bottomed in July 2021 at 214 per day.
MBA Survey: "Share of Mortgage Loans in Forbearance Decreases to 0.85% in May"
by Calculated Risk on 6/21/2022 04:00:00 PM
Note: This is as of May 31st.
From the MBA: Share of Mortgage Loans in Forbearance Decreases to 0.85% in May
The Mortgage Bankers Association’s (MBA) monthly Loan Monitoring Survey revealed that the total number of loans now in forbearance decreased by 9 basis points from 0.94% of servicers’ portfolio volume in the prior month to 0.85% as of May 31, 2022. According to MBA’s estimate, 425,000 homeowners are in forbearance plans.
The share of Fannie Mae and Freddie Mac loans in forbearance decreased 5 basis points to 0.38%. Ginnie Mae loans in forbearance decreased 4 basis points to 1.25%, and the forbearance share for portfolio loans and private-label securities (PLS) declined 29 basis points to 1.86%.
“Servicers are whittling away at the remaining loans in forbearance, even as the pace of monthly forbearance exits slowed in May to a new survey low. Most borrowers exiting forbearance are moving into either a loan modification, payment deferral, or a combination of the two workout options,” said Marina Walsh, CMB, MBA’s Vice President of Industry Analysis.
Added Walsh, “It is a positive sign to see the overall servicing portfolio performance reach 95.85 percent current in May – 21 basis points higher than April’s figures. However, it is worth watching if the rapid increase in interest rates for all loans, combined with inflation that is outpacing wage growth, complicates post-forbearance workout options and puts additional pressure on borrowers in existing post-forbearance workouts.”
emphasis added
 Click on graph for larger image.
This graph shows the percent of portfolio in forbearance by investor type over time.
The share of forbearance plans is decreasing, and, at the end of May, there were about 425,000 homeowners in forbearance plans.
More Analysis on May Existing Home Sales
by Calculated Risk on 6/21/2022 10:55:00 AM
Today, in the CalculatedRisk Real Estate Newsletter: NAR: Existing-Home Sales Decreased to 5.41 million SAAR in May
Excerpt:
Sales in May (5.41 million SAAR) were down 3.4% from the previous month and were 8.6% below the May 2021 sales rate. Sales in April were revised down.There is much more in the article. You can subscribe at https://calculatedrisk.substack.com/ (Most content is available for free, so please subscribe).
The second graph shows existing home sales by month for 2021 and 2022.
Sales declined 8.6% year-over-year compared to April 2021. This was the ninth consecutive month with sales down year-over-year.
...
Key point on Timing of Sales
Existing home sales are reported when the transaction closes. So, sales in May are mostly for contracts signed in March and April when mortgage rates were significantly lower than today (and many buyers locked in the mortgage rate as soon as possible).
30-year mortgage rates in March were around 4.2% according to Freddie Mac. And rates increased to around 5% in April. Now rates are slightly over 6%.
My sense is contracts for sales really declined in June, and that will show up as closed sales in July and August.

NAR: Existing-Home Sales Decreased to 5.41 million SAAR in May
by Calculated Risk on 6/21/2022 10:11:00 AM
From the NAR: Existing-Home Sales Fell 3.4% in May; Median Sales Price Surpasses $400,000 for the First Time
Existing-home sales retreated for the fourth consecutive month in May, according to the National Association of Realtors®. Month-over-month sales declined in three out of four major U.S. regions, while year-over-year sales slipped in all four regions.
Total existing-home sales, completed transactions that include single-family homes, townhomes, condominiums and co-ops, fell 3.4% from April to a seasonally adjusted annual rate of 5.41 million in May. Year-over-year, sales receded 8.6% (5.92 million in May 2021).
...
Total housing inventory registered at the end of May was 1,160,000 units, an increase of 12.6% from April and a 4.1% decline from the previous year (1.21 million). Unsold inventory sits at a 2.6-month supply at the current sales pace, up from 2.2 months in April and 2.5 months in May 2021.
emphasis added
 Click on graph for larger image.
This graph shows existing home sales, on a Seasonally Adjusted Annual Rate (SAAR) basis since 1993.
Sales in May (5.41 million SAAR) were down 3.4% from the previous month and were 8.6% below the May 2021 sales rate. Sales in April were revised down.
The second graph shows nationwide inventory for existing homes.
 According to the NAR, inventory increased to 1.16 million in May from 1.03 million in April.
Headline inventory is not seasonally adjusted, and inventory usually decreases to the seasonal lows in December and January, and peaks in mid-to-late summer.
The last graph shows the year-over-year (YoY) change in reported existing home inventory and months-of-supply. Since inventory is not seasonally adjusted, it really helps to look at the YoY change. Note: Months-of-supply is based on the seasonally adjusted sales and not seasonally adjusted inventory.
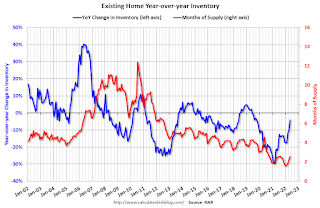 Inventory was down 4.1% year-over-year (blue) in May compared to May 2021.
Months of supply (red) increased to 2.6 months in May from 2.2 months in April.
This was close to the consensus forecast. I'll have more later.
The last graph shows the year-over-year (YoY) change in reported existing home inventory and months-of-supply. Since inventory is not seasonally adjusted, it really helps to look at the YoY change. Note: Months-of-supply is based on the seasonally adjusted sales and not seasonally adjusted inventory.
 Inventory was down 4.1% year-over-year (blue) in May compared to May 2021.
 Months of supply (red) increased to 2.6 months in May from 2.2 months in April.
This was close to the consensus forecast. I'll have more later.
DOT: Vehicle Miles Driven Increased Slightly year-over-year in April
by Calculated Risk on 6/21/2022 08:30:00 AM
This will be something to watch with higher gasoline prices.
The Department of Transportation (DOT) reported:
Travel on all roads and streets changed by +1.5% (+3.9 billion vehicle miles) for April 2022 as compared with April 2021. Travel for the month is estimated to be 263.1 billion vehicle miles.
The seasonally adjusted vehicle miles traveled for April 2022 is 270.7 billion miles, a 2.50% ( 6.6 billion vehicle miles) change over April 2021. It also represents a -0.9% change (-2.4 billion vehicle miles) compared with March 2022.
Cumulative Travel for 2022 changed by +4.5% (+44.0 billion vehicle miles). The cumulative estimate for the year is 1,016.7 billion vehicle miles of travel.
emphasis added
 Click on graph for larger image.
This graph shows the monthly total vehicle miles driven, seasonally adjusted.
Miles driven declined sharply in March 2020, and really collapsed in April 2020. After recovering, miles driven might be starting to soften due to high gasoline prices.


