 RSS Feed
 by Calculated Risk on 5/09/2022 02:06:00 PM
Monday, May 09, 2022
Fed Survey: Banks reported Eased Standards, Weaker Demand for Residential Real Estate Loans
From the Federal Reserve: The April 2022 Senior Loan Officer Opinion Survey on Bank Lending Practices
The April 2022 Senior Loan Officer Opinion Survey on Bank Lending Practices addressed changes in the standards and terms on, and demand for, bank loans to businesses and households over the past three months, which generally correspond to the first quarter of 2022.
Regarding loans to businesses, respondents to the survey reported, on balance, unchanged standards for commercial and industrial (C&I) loans to firms of all sizes, after having eased them over the previous four quarters, while demand strengthened over the first quarter. Meanwhile, banks reported unchanged standards and demand for most commercial real estate (CRE) loan categories except for those secured by multifamily residential properties, for which they eased standards and demand strengthened on net.
Banks also responded to a set of special questions about changes in lending policies and demand for CRE loans over the past year. Banks reportedly eased some lending terms across all CRE loan categories, including the maximum loan size and maturity, the spread of loan rates over their cost of funds, the length of interest-only periods, and the market areas served.
For loans to households, banks eased standards across most categories of residential real estate (RRE) loans and home equity lines of credit (HELOCs) over the first quarter, while also reporting weaker demand for all types of RRE loans but stronger demand for HELOCs on net. In addition, banks eased standards for card loans and auto loans, while demand reportedly strengthened for all consumer loan types over the first quarter
emphasis added
 Click on graph for larger image.
This graph on Residential Real Estate lending is from the Senior Loan Officer Survey Charts.
This shows that banks have eased standards for residential real estate.
The second graph shows demand for residential real estate.
 This was was Q1. Demand is probably dropping sharply in Q2.
Housing Market: Where it's at. Where it's going. May 2022 Update
by Calculated Risk on 5/09/2022 11:08:00 AM
Today, in the Calculated Risk Real Estate Newsletter: Housing Market: Where it's at. Where it's going.
A brief excerpt:
House prices are up 20% year-over-year. Inventory is near record lows. And real estate agents are still selling homes well above list price. And on credit, lending standards have been reasonably solid, and mortgage delinquencies are very low.There is much more in the article. You can subscribe at https://calculatedrisk.substack.com/
However, mortgage rates are up sharply (from 3% six months ago to 5.64% today), and we are starting to see an increase in inventory levels. House prices are too high based on fundamentals like price-to-income and price-to-rent. And some investors appear to be pulling back due to higher cap rates, and some builders are reporting buyers actually want to negotiate on price!
...
On mortgage rates, it is the change in monthly payments that impacts housing. Monthly payments include principal, interest, taxes, insurance (PITI), and sometimes HOA fees (Homeowners Association). We could also include maintenance, utilities and other costs. The following graph shows the year-over-year change in principal & interest (P&I) assuming a fixed loan amount since 1977. Currently P&I is up about 35% year-over-year for a fixed amount (this doesn’t take into account the change in house prices).
The last time we saw an increase like this in monthly payments was in the ‘78 to’82 period. This is one reason I’ve been suggesting Housing: Don't Compare the Current Housing Boom to the Bubble and Bust, Look instead at the 1978 to 1982 period for lessons.

Housing Inventory May 9th Update: Inventory Down 1.6% Year-over-Year
by Calculated Risk on 5/09/2022 09:00:00 AM
Tracking existing home inventory is very important in 2022.
Inventory usually declines in the winter, and then increases in the spring. Inventory bottomed seasonally at the beginning of March 2022 and is now up 27% since then.
 Click on graph for larger image in graph gallery.
This inventory graph is courtesy of Altos Research.
As of May 6th, inventory was at 305 thousand (7-day average), compared to 292 thousand the prior week. Inventory was up 4.5% from the previous week.
Last year inventory bottomed seasonally in April 2021 - very late in the year. This year, by this measure, inventory bottomed seasonally at the beginning of March.
Inventory is still very low. Compared to the same week in 2021, inventory is down 1.6% from 310 thousand, but compared to the same week in 2020, and inventory is down 58.3% from 732 thousand. Compared to 3 years ago, inventory is down 66.1% from 902 thousand.
Here are the inventory milestones I’m watching for with the Altos data:
1. The seasonal bottom (already happened on March 4th for Altos)✅
2. Inventory up year-over-year (likely next week)
3. Inventory up compared to two years ago (currently down 58% according to Altos)
4. Inventory back to 1999 levels (currently down 66%).
For the second milestone, here is a table of the year-over-year change by week since the beginning of the year.
| Week Ending | YoY Change |
|---|---|
| 12/31/2021 | -30.0% |
| 1/7/2022 | -26.0% |
| 1/14/2022 | -28.6% |
| 1/21/2022 | -27.1% |
| 1/28/2022 | -25.9% |
| 2/4/2022 | -27.9% |
| 2/11/2022 | -27.5% |
| 2/18/2022 | -25.8% |
| 2/25/2022 | -24.9% |
| 3/4/2022 | -24.2% |
| 3/11/2022 | -21.7% |
| 3/18/2022 | -21.7% |
| 3/25/2022 | -19.0% |
| 4/1/2022 | -17.6% |
| 4/8/2022 | -14.8% |
| 4/15/2022 | -13.1% |
| 4/22/2022 | -11.2% |
| 4/29/2022 | -4.9% |
| 5/6/2022 | -1.6% |

Here is a graph of the year-over-year change in the Altos data.
The blue trend line is from the beginning of the year, and the red trend line is over the last 8 weeks.
Currently it appears inventory will be up year-over-year next week.
Mike Simonsen discusses this data regularly on Youtube.
Four High Frequency Indicators for the Economy
by Calculated Risk on 5/09/2022 08:27:00 AM
These indicators are mostly for travel and entertainment. It is interesting to watch these sectors recover as the pandemic subsides. Note: Apple has discontinued "Apple mobility", and restaurant traffic is mostly back to normal.
The TSA is providing daily travel numbers.
This data is as of May 8th.
 Click on graph for larger image.
This data shows the 7-day average of daily total traveler throughput from the TSA for 2019 (Light Blue), 2020 (Black), 2021 (Blue) and 2022 (Red).
The dashed line is the percent of 2019 for the seven-day average.
The 7-day average is down 11.7% from the same day in 2019 88.3% of 2019). (Dashed line)
Air travel has been moving sideways over the last two months, off about 10% from 2019.
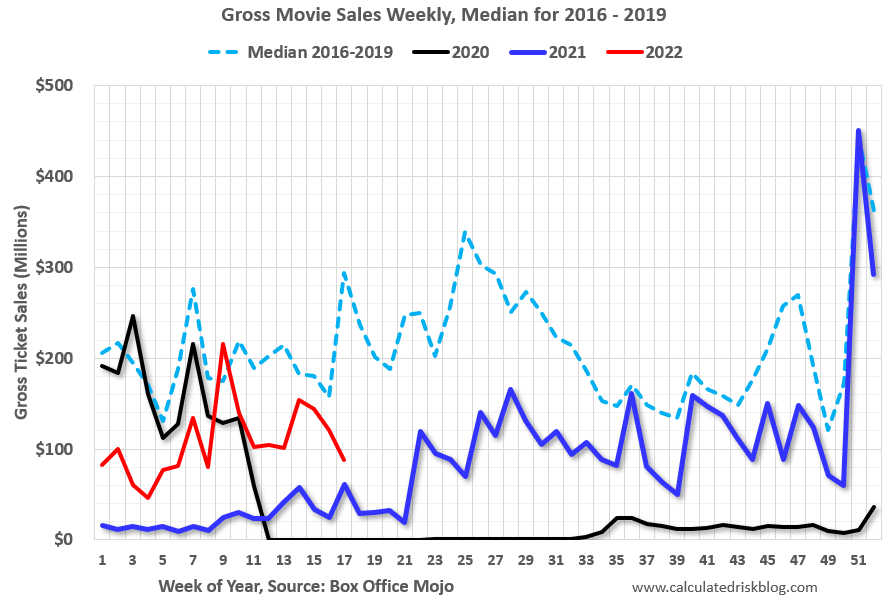 This data shows domestic box office for each week and the median for the years 2016 through 2019 (dashed light blue).
 Black is 2020, Blue is 2021 and Red is 2022.
The data is from BoxOfficeMojo through May 5th.
Note that the data is usually noisy week-to-week and depends on when blockbusters are released.
Movie ticket sales were at $87 million last week, down about 70% from the median for the week.
Note that the data is usually noisy week-to-week and depends on when blockbusters are released.
Movie ticket sales were at $87 million last week, down about 70% from the median for the week.
 This graph shows the seasonal pattern for the hotel occupancy rate using the four-week average.
 The red line is for 2022, black is 2020, blue is the median, and dashed light blue is for 2021.
This data is through April 30th. The occupancy rate was down 3.4% compared to the same week in 2019.
The 4-week average of the occupancy rate is at the median rate for the previous 20 years (Blue).
Notes: Y-axis doesn't start at zero to better show the seasonal change.
Notes: Y-axis doesn't start at zero to better show the seasonal change.
The 4-week average of the occupancy rate will now mostly move sideways seasonally until the summer.
Here is some interesting data on New York subway usage (HT BR).
 This graph is from Todd W Schneider.
 This graph shows how much MTA traffic has recovered in each borough (Graph starts at first week in January 2020 and 100 = 2019 average).
Manhattan is at about 39% of normal.
This data is through Friday, May 6th.
He notes: "Data updates weekly from the MTA’s public turnstile data, usually on Saturday mornings".
Sunday, May 08, 2022
Sunday Night Futures
by Calculated Risk on 5/08/2022 06:40:00 PM
Weekend:
• Schedule for Week of May 8, 2022
Monday:
• At 2:00 PM ET, Senior Loan Officer Opinion Survey on Bank Lending Practices for April.
From CNBC: Pre-Market Data and Bloomberg futures S&P 500 are down 25 and DOW futures are down 170 (fair value).
Oil prices were up over the last week with WTI futures at $109.60 per barrel and Brent at $112.24 per barrel. A year ago, WTI was at $66 and Brent was at $69 - so WTI oil prices are up 70% year-over-year.
Here is a graph from Gasbuddy.com for nationwide gasoline prices. Nationally prices are at $4.31 per gallon. A year ago prices were at $2.95 per gallon, so gasoline prices are up $1.36 per gallon year-over-year.
Vehicle Sales Mix and Heavy Trucks
by Calculated Risk on 5/08/2022 09:49:00 AM
It will be interesting to see if high gasoline prices will lead to a higher percentage of passenger car sales.
This graph shows the percent of light vehicle sales between passenger cars and trucks / SUVs through April 2022.
 Over time the mix has changed more and more towards light trucks and SUVs.
Only when oil prices are high, does the trend slow or reverse.
The percent of light trucks and SUVs was at 79.0% in April 2022 - just below the record high percentage of 80.0% last October.
The second graph shows heavy truck sales since 1967 using data from the BEA. The dashed line is the April 2022 seasonally adjusted annual sales rate (SAAR).
 Heavy truck sales really collapsed during the great recession, falling to a low of 180 thousand SAAR in May 2009. Then heavy truck sales increased to a new all-time high of 563 thousand SAAR in September 2019.
Note: "Heavy trucks - trucks more than 14,000 pounds gross vehicle weight."
Heavy truck sales really declined at the beginning of the pandemic, falling to a low of 299 thousand SAAR in May 2020.
Heavy truck sales were at 467 thousand SAAR in April, unchanged from March, and down 3% from 482 thousand SAAR in April 2021.
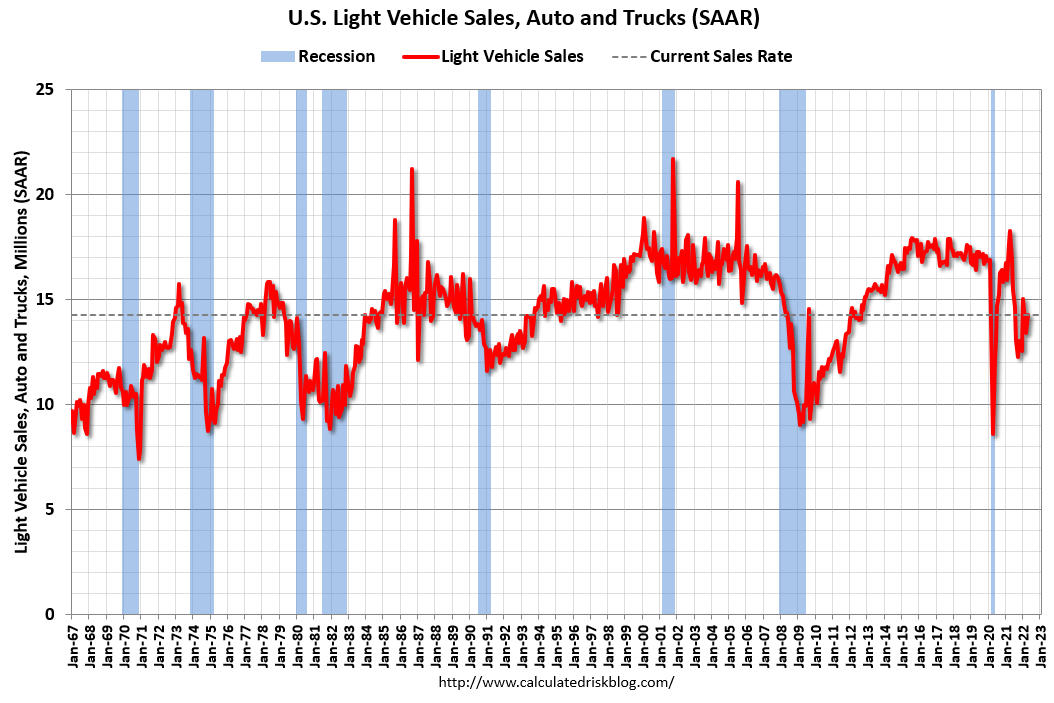 The last graph shows light vehicle sales since the BEA started keeping data in 1967. The BEA reported sales of 14.29 million SAAR in April 2022 (Seasonally Adjusted Annual Rate), up 6.6% from the March sales rate, and down 21.9% from April 2021.
The impact of COVID-19 was significant, and April 2020 was the worst month. After April 2020, sales increased, and were close to sales in 2019 (the year before the pandemic).
However, sales decreased late last year due to supply issues. It appears the "supply chain bottom" was in September 2021, and sales in April were above the consensus forecast of 13.8 million SAAR.
Sales are still weak but picking up.
Saturday, May 07, 2022
Real Estate Newsletter Articles this Week
by Calculated Risk on 5/07/2022 02:11:00 PM
At the Calculated Risk Real Estate Newsletter this week:
• Housing: "What Killed the Home ATM in 2006?"
• Black Knight Mortgage Monitor: Record Low Delinquencies, "Home Affordability Nears All-Time Low"
• Rent Increases Up Sharply Year-over-year, Pace may be slowing
• Denver Real Estate in April: Active Inventory up Sharply
• Lawler: Mortgage/Treasury Spreads, Part I
• 1st Look at Local Housing Markets in April Realtor.com shows active inventory down only 3% year-over-year
This is usually published 4 to 6 times a week and provides more in-depth analysis of the housing market.
The blog will continue as always!
You can subscribe at https://calculatedrisk.substack.com/
Most content is available for free (and no Ads), but please subscribe!
Schedule for Week of May 8, 2022
by Calculated Risk on 5/07/2022 08:11:00 AM
The key report this week is April CPI.
Note: The Census Bureau is expected to release "National, State, and County housing units" from the 2020 Census sometime in May.
2:00 PM: Senior Loan Officer Opinion Survey on Bank Lending Practices for April.
6:00 AM ET: NFIB Small Business Optimism Index for April.
11:00 AM: NY Fed: Q1 Quarterly Report on Household Debt and Credit
7:00 AM ET: The Mortgage Bankers Association (MBA) will release the results for the mortgage purchase applications index.
8:30 AM: The Consumer Price Index for April from the BLS. The consensus is for 0.2% increase in CPI (up 8.1% YoY), and a 0.4% increase in core CPI (up 6.1% YoY).
8:30 AM: The initial weekly unemployment claims report will be released. The consensus is for 210 thousand up from 200 thousand last week.
8:30 AM: The Producer Price Index for April from the BLS. The consensus is for a 0.5% increase in PPI, and a 0.6% increase in core PPI.
10:00 AM: University of Michigan's Consumer sentiment index (Preliminary for May).
10:00 AM: NY Fed: Climate Change: Implications for Macroeconomics
Friday, May 06, 2022
COVID May 6, 2022: New Cases, Hospitalizations and Deaths Increasing
by Calculated Risk on 5/06/2022 09:21:00 PM
On COVID (focus on hospitalizations and deaths):
| COVID Metrics | ||||
|---|---|---|---|---|
| Now | Week Ago | Goal | ||
| Percent fully Vaccinated | 66.3% | --- | ≥70.0%1 | |
| Fully Vaccinated (millions) | 220.0 | --- | ≥2321 | |
| New Cases per Day3🚩 | 67,263 | 54,883 | ≤5,0002 | |
| Hospitalized3🚩 | 12,602 | 11,162 | ≤3,0002 | |
| Deaths per Day3🚩 | 341 | 315 | ≤502 | |
| 1 Minimum to achieve "herd immunity" (estimated between 70% and 85%). 2my goals to stop daily posts, 37-day average for Cases, Currently Hospitalized, and Deaths 🚩 Increasing 7-day average week-over-week for Cases, Hospitalized, and Deaths ✅ Goal met. | ||||
 Click on graph for larger image.
This graph shows the daily (columns) and 7-day average (line) of deaths reported.
Average daily deaths bottomed in July 2021 at 214 per day.
AAR: April Rail Carloads and Intermodal Down Year-over-year
by Calculated Risk on 5/06/2022 03:46:00 PM
From the Association of American Railroads (AAR) Rail Time Indicators. Graphs and excerpts reprinted with permission.
U.S. rail traffic in April 2022 was like a box of assorted chocolates: it had something for everyone. Optimists can point to several commodities that had solid traffic gains. For example, April 2022 was the third best month ever for carloads of chemicals, with carloads up 3.4% over last year. April’s carloads of iron and steel scrap were the highest since August 2013, while carloads of autos and auto parts were up 12.0% over last year. Carloads of food products and crushed stone and sand were also up.
Pessimists can point to several traffic categories with lower volumes in April. For example, carloads of grain in April were the fewest in seven months, coal carloads were the lowest in more than a year, and carloads of petroleum products were their second lowest since September 2017.
emphasis added
 Click on graph for larger image.
This graph from the Rail Time Indicators report shows the six-week average of U.S. Carloads in 2020, 2021 and 2022:
Total carloads on U.S. railroads fell 3.4% in April 2022 from April 2021, their second monthly decline so far this year following 10 straight monthly gains from March to December 2021. For 2022 through April, total carloads were up 1.1% over the same period in 2021.
 The second graph shows the six-week average (not monthly) of U.S. intermodal in 2020, 2021 and 2022: (using intermodal or shipping containers):
U.S. railroads originated an average of 270,788 intermodal containers and trailers per week in April 2022. That’s the most since August 2021, but down 7.7% from April 2021. For context, April 2021 was the best intermodal month in history for U.S. railroads.


