 RSS Feed
 by Calculated Risk on 1/19/2022 07:10:00 PM
Wednesday, January 19, 2022
Thursday: Existing Home Sales, Unemployment Claims, Philly Fed Mfg
Thursday:
• At 8:30 AM ET, The initial weekly unemployment claims report will be released. The consensus is for 230 thousand initial claims.
• Also at 8:30 AM, the Philly Fed manufacturing survey for January. The consensus is for a reading of 23.0, up from 15.4.
• At 10:00 AM, Existing Home Sales for December from the National Association of Realtors (NAR). The consensus is for 6.45 million SAAR, down from 6.46 million. Housing economist Tom Lawler expects the NAR to report 6.33 million SAAR.
On COVID (focus on hospitalizations and deaths):
| COVID Metrics | ||||
|---|---|---|---|---|
| Now | Week Ago | Goal | ||
| Percent fully Vaccinated | 63.1% | --- | ≥70.0%1 | |
| Fully Vaccinated (millions) | 209.5 | --- | ≥2321 | |
| New Cases per Day3 | 755,095 | 763,722 | ≤5,0002 | |
| Hospitalized3🚩 | 142,595 | 125,106 | ≤3,0002 | |
| Deaths per Day3 | 1,669 | 1,687 | ≤502 | |
| 1 Minimum to achieve "herd immunity" (estimated between 70% and 85%). 2my goals to stop daily posts, 37-day average for Cases, Currently Hospitalized, and Deaths 🚩 Increasing 7-day average week-over-week for Cases, Hospitalized, and Deaths ✅ Goal met. | ||||
 Click on graph for larger image.
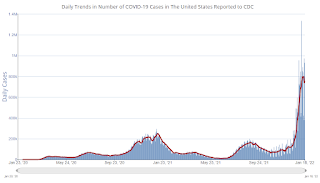
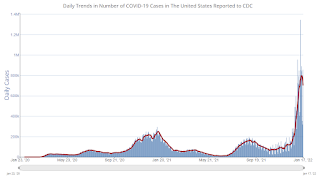
This graph shows the daily (columns) and 7-day average (line) of positive tests reported.
The 7-day average for new cases are just below record levels. Hospitalizations are at record levels.
Fortunately, deaths are still only half the previous 7-day average record of 3,421 per day in January 2021.
AIA: "Architecture firms end 2021 on a strong note" in December
by Calculated Risk on 1/19/2022 12:27:00 PM
Note: This index is a leading indicator primarily for new Commercial Real Estate (CRE) investment.
From the AIA: Architecture firms end 2021 on a strong note
As architecture firms ended 2021 on a high note with strong business conditions, staff recruitment is becoming a growing concern among firms.
December’s Architectural Billings Index (ABI) score of 52.0 was an increase from 51.0 in November (any score over 50 indicates billings growth). Despite a variety of concerns related to the omicron variant, labor shortages, and rising prices as well as limited availability of construction materials, firms continued to report a robust supply of work in the pipeline. Inquiries into new work and the value of new design contracts both remained strong, and backlogs, at an average of 6.5 months, remained near their highest levels since the AIA began tracking this metric in 2010.
“Since demand for design projects has been healthy over the last year, recruiting architectural staff to keep up with project workloads has been a growing concern for firms,” said AIA Chief Economist, Kermit Baker, Hon. AIA, PhD. “Architecture is one of the few industries where payrolls have already surpassed their pre-pandemic high, so meeting future staffing needs is a challenge that most firms will need to confront."
...
• Regional averages: South (56.4); Midwest (51.0); West (47.5); Northeast (45.3)
• Sector index breakdown: mixed practice (60.6); multi-family residential (49.2); commercial/industrial (49.2); institutional (47.6)
emphasis added
 Click on graph for larger image.
This graph shows the Architecture Billings Index since 1996. The index was at 52.0 in December, up from 51.0 in November. Anything above 50 indicates expansion in demand for architects' services.
Note: This includes commercial and industrial facilities like hotels and office buildings, multi-family residential, as well as schools, hospitals and other institutions.
This index was below 50 for eleven consecutive months but has been positive for the last eleven months.
The eleven months of decline represented a significant decrease in design services and suggested a decline in CRE investment through most of 2021 (This index usually leads CRE investment by 9 to 12 months), however this index suggests a pickup in CRE investment in 2022.
December Housing Starts: Most Housing Units Under Construction Since 1973
by Calculated Risk on 1/19/2022 10:42:00 AM
Today, in the CalculatedRisk Real Estate Newsletter: December Housing Starts: Most Housing Units Under Construction Since 1973
Excerpt:
The 1.595 million total starts in 2021 were up 15.6% from 1.380 million in 2020. Starts in 2021 were the most since 2006 when 1.801 million units were started.There is much more in the post. You can subscribe at https://calculatedrisk.substack.com/ (Most content is available for free, so please subscribe).
The fourth graph shows housing starts under construction, Seasonally Adjusted (SA).
Red is single family units. Currently there are 769 thousand single family units under construction (SA). This is the highest level since February 2007.
For single family, most of these homes are already sold (Census counts sales when contract is signed). The reason there are so many homes is probably due to construction delays. Since most of these are already sold, it is unlikely this is “overbuilding”, or that this will impact prices (although the buyers will be moving out of their current home or apartment once these homes are completed).
Blue is for 2+ units. Currently there are 750 thousand multi-family units under construction. This is the highest level since July 1974! For multi-family, construction delays are probably also a factor. The completion of these units should help with rent pressure.
Census will release data in March (part of February survey) on the length of time from start to completion, and that will probably show long delays in 2021. In 2020, it took an average of 6.8 months from start to completion for single family homes, and 15.4 months for buildings with 2 or more units.
Combined, there are 1.519 million units under construction. This is the most since November 1973.
Housing Starts Increased to 1.702 million Annual Rate in December
by Calculated Risk on 1/19/2022 08:38:00 AM
From the Census Bureau: Permits, Starts and Completions
Housing Starts:
Privately‐owned housing starts in December were at a seasonally adjusted annual rate of 1,702,000. This is 1.4 percent above the revised November estimate of 1,678,000 and is 2.5 percent (±13.8 percent)* above the December 2020 rate of 1,661,000. Single‐family housing starts in December were at a rate of 1,172,000; this is 2.3 percent below the revised November figure of 1,199,000. The December rate for units in buildings with five units or more was 524,000.
An estimated 1,595,100 housing units were started in 2021. This is 15.6 percent (±4.0 percent) above the 2020 figure of 1,379,600.
Building Permits:
Privately‐owned housing units authorized by building permits in December were at a seasonally adjusted annual rate of 1,873,000. This is 9.1 percent above the revised November rate of 1,717,000 and is 6.5 percent above the December 2020 rate of 1,758,000. Single‐family authorizations in December were at a rate of 1,128,000; this is 2.0 percent above the revised November figure of 1,106,000. Authorizations of units in buildings with five units or more were at a rate of 675,000 in December. [Special Note: In December, there was a large increase in building permits issued in Philadelphia, PA. Philadelphia enacted several real estate tax changes for residential projects permitted after December 31, 2021.]
An estimated 1,724,700 housing units were authorized by building permits in 2021. This is 17.2 percent (±0.6 percent) above the 2020 figure of 1,471,100.
emphasis added
 Click on graph for larger image.
The first graph shows single and multi-family housing starts for the last several years.
Multi-family starts (blue, 2+ units) increased in December compared to November. Multi-family starts were up 53% year-over-year in December.
Single-family starts (red) decreased in December and were down 10.9% year-over-year.
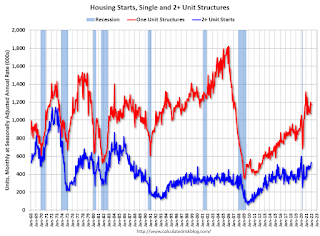 The second graph shows single and multi-family housing starts since 1968.
 This shows the huge collapse following the housing bubble, and then the eventual recovery (but still not historically high).
Total housing starts in December were above expectations and starts in October and November were revised up slightly, combined.
I'll have more later …
MBA: Mortgage Applications Increase in Latest Weekly Survey
by Calculated Risk on 1/19/2022 07:00:00 AM
From the MBA: Mortgage Applications Increase in Latest MBA Weekly Survey
Mortgage applications increased 2.3 percent from one week earlier, according to data from the Mortgage Bankers Association’s (MBA) Weekly Mortgage Applications Survey for the week ending January 14, 2022.
... The Refinance Index decreased 3 percent from the previous week and was 49 percent lower than the same week one year ago. The seasonally adjusted Purchase Index increased 8 percent from one week earlier. The unadjusted Purchase Index increased 14 percent compared with the previous week and was 13 percent lower than the same week one year ago.
“Mortgage rates hit their highest levels since March 2020, leading to the slowest pace of refinance activity in over two years. The 30-year fixed rate reached 3.64 percent and has increased more than 30 basis points over the past two weeks. FHA and VA refinance declines drove most of the refinance slowdown,” said Joel Kan, MBA’s Associate Vice President of Economic and Industry Forecasting. “Despite the increase in rates, purchase applications jumped almost 8 percent, with conventional purchase applications accounting for much of the stronger activity. The average loan size for a purchase application set a record at $418,500. The continued rise in purchase loan application sizes is driven by high home price appreciation and the lack of housing inventory on the market – especially for entry-level homes. The slower growth in government purchase activity is also contributing to the larger loan balances and suggests that prospective first-time buyers are struggling to find homes to buy in their price range.”
...
The average contract interest rate for 30-year fixed-rate mortgages with conforming loan balances ($647,200 or less) increased to 3.64 percent from 3.52 percent, with points remaining unchanged at 0.45 (including the origination fee) for 80 percent loan-to-value ratio (LTV) loans.
emphasis added
 Click on graph for larger image.
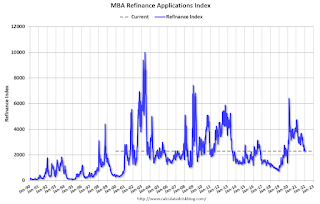
The first graph shows the refinance index since 1990.
The refinance index will probably decline sharply again next week.
The second graph shows the MBA mortgage purchase index
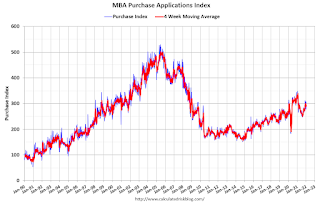 According to the MBA, purchase activity is down 13% year-over-year unadjusted.
Note: Red is a four-week average (blue is weekly).
Tuesday, January 18, 2022
Wednesday: Housing Starts
by Calculated Risk on 1/18/2022 08:52:00 PM
From Matthew Graham at Mortgage News Daily: Remember Mortgage Rates in the 2's? They're Closer to 4% Now
One of the very few welcome byproducts of the pandemic was the pervasive availability of new all-time low mortgage rates. Depending on when you checked in, you were highly likely to see top tier 30yr fixed rates in the 2% range. ... The average lender is now up to 3.75% after starting the day at 3.625%. [30 year fixed 3.70%]Wednesday:
emphasis added
• At 7:00 AM ET, The Mortgage Bankers Association (MBA) will release the results for the mortgage purchase applications index.
• At 8:30 AM, Housing Starts for December. The consensus is for 1.655 million SAAR, down from 1.679 million SAAR.
• During the day, The AIA's Architecture Billings Index for December (a leading indicator for commercial real estate).
On COVID (focus on hospitalizations and deaths):
| COVID Metrics | ||||
|---|---|---|---|---|
| Now | Week Ago | Goal | ||
| Percent fully Vaccinated | 63.0% | --- | ≥70.0%1 | |
| Fully Vaccinated (millions) | 209.3 | --- | ≥2321 | |
| New Cases per Day3 | 701,277 | 752,342 | ≤5,0002 | |
| Hospitalized3🚩 | 137,384 | 120,397 | ≤3,0002 | |
| Deaths per Day3🚩 | 1,746 | 1,664 | ≤502 | |
| 1 Minimum to achieve "herd immunity" (estimated between 70% and 85%). 2my goals to stop daily posts, 37-day average for Cases, Currently Hospitalized, and Deaths 🚩 Increasing 7-day average week-over-week for Cases, Hospitalized, and Deaths ✅ Goal met. | ||||
 Click on graph for larger image.
This graph shows the daily (columns) and 7-day average (line) of positive tests reported.
The 7-day average for new cases are just below record levels. Hospitalizations are at record levels.
Fortunately, deaths are still only half the previous 7-day average record of 3,421 per day in January 2021.
Lawler: Early Read on Existing Home Sales in December
by Calculated Risk on 1/18/2022 04:26:00 PM
From housing economist Tom Lawler:
Based on publicly-available local realtor/MLS reports released across the country through today, I project that existing home sales as estimated by the National Association of Realtors ran at a seasonally adjusted annual rate of 6.33 million in December, down 2.0% from November’s preliminary pace and down 4.8% from last December’s seasonally adjusted pace.
Local realtor reports, as well as reports from national inventory trackers, suggest that the YOY % decline in the inventory of existing homes for sale last month similar to the drop in November.
Finally, local realtor/MLS reports suggest the median existing single-family home sales price last month was up by about 14.5% from last December.
CR Note: The National Association of Realtors (NAR) is scheduled to release November existing home sales on Thursday, January 20, 2022, at 10:00 AM ET. The consensus is for 6.45 million SAAR. Take the under.
MBA Survey: "Share of Mortgage Loans in Forbearance Decreases to 1.41% in December 2021"
by Calculated Risk on 1/18/2022 04:00:00 PM
Note: This is as of December 31st.
From the MBA: Share of Mortgage Loans in Forbearance Decreases to 1.41% in December 2021
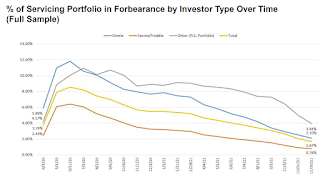
The Mortgage Bankers Association’s (MBA) new monthly Loan Monitoring Survey revealed that the total number of loans now in forbearance decreased by 26 basis points from 1.67% of servicers’ portfolio volume in the prior month to 1.41% as of December 31, 2021. According to MBA’s estimate, 705,000 homeowners are in forbearance plans.
The share of Fannie Mae and Freddie Mac loans in forbearance decreased 8 basis points to 0.68%. Ginnie Mae loans in forbearance decreased 47 basis points to 1.63%, and the forbearance share for portfolio loans and private-label securities (PLS) declined 51 basis points to 3.43%.
“The share of loans in forbearance continued to decline in December 2021. This was especially the case for government and private-label and portfolio loans, as those loans have higher levels of forbearance than loans backed by Fannie Mae and Freddie Mac,” said Marina Walsh, CMB, MBA’s Vice President of Industry Analysis. “With the number of borrowers in forbearance continuing to decrease below 750,000, the pace of monthly forbearance exits reached its lowest level since MBA started tracking exits in June 2020.”
Added Walsh, “It is likely that the remaining borrowers in forbearance have experienced either a permanent hardship that may require more complex loan workout solutions, or they have encountered a recent hardship for which they are now seeking relief.” emphasis added
 Click on graph for larger image.
This graph shows the percent of portfolio in forbearance by investor type over time. The number of forbearance plans is decreasing rapidly recently since many homeowners have reached the end of the 18-month term.
4th Look at Local Housing Markets in December
by Calculated Risk on 1/18/2022 02:09:00 PM
Today, in the Calculated Risk Real Estate Newsletter: 4th Look at Local Housing Markets in December
A brief excerpt:
Here is a summary of active listings for these housing markets in December. Inventory was down 19.2% in December month-over-month (MoM) from November, and down 29.2% year-over-year (YoY).There is much more in the article. You can subscribe at https://calculatedrisk.substack.com/
Inventory almost always declines seasonally in December, so the MoM decline is not a surprise. Last month, these markets were down 25.5% YoY, so the YoY decline in December is larger than in November. This isn’t indicating a slowing market.
Notes for all tables:
1. New additions to table in BOLD.
2. Northwest (Seattle), North Texas (Dallas), and Santa Clara (San Jose), Jacksonville, Source: Northeast Florida Association of REALTORS®
Totals do not include Denver (included in state total).
NAHB: Builder Confidence Decreased to 83 in January
by Calculated Risk on 1/18/2022 10:05:00 AM
The National Association of Home Builders (NAHB) reported the housing market index (HMI) was at 83, down from 84 in December. Any number above 50 indicates that more builders view sales conditions as good than poor.
From the NAHB: Builder Confidence Edges Lower on Inflation Concerns
Growing inflation concerns and ongoing supply chain disruptions snapped a four-month rise in builder sentiment even as consumer demand remains robust. Builder confidence in the market for newly built single-family homes moved one point lower to 83 in January, according to the National Association of Home Builders (NAHB)/Wells Fargo Housing Market Index (HMI). The HMI has hovered at the 83 or 84 level, the same rate as the spring of 2021, for the past three months.
Higher material costs and lack of availability are adding weeks to typical single-family construction times. NAHB analysis indicates the aggregate cost of residential construction materials has increased almost 19% since December 2021. Policymakers need to take action to fix supply chains. Obtaining a new softwood lumber agreement with Canada and reducing tariffs is an excellent place to start.
The most pressing issue for the housing sector remains a lack of inventory. Building has increased but the industry faces constraints, namely cost/availability of materials, labor and lots. And while 2021 single-family starts are expected to end the year about 25% higher than the pre-Covid 2019 level, we expect higher interest rates in 2022 will put a damper on housing affordability.
It is worth noting that the HMI responses for the January survey were collected January 3 through January 13, with many responses collected before interest rates jumped last week. The impact of these higher rates will be more fully reflected in the February HMI.
...
The HMI index gauging current sales conditions held steady at 90, the gauge measuring sales expectations in the next six months fell two points to 83, and the component charting traffic of prospective buyers also posted a two-point decline to 69.
Looking at the three-month moving averages for regional HMI scores, the Northeast fell one point to 73, the Midwest increased one point to 75 and the South and West each posted a one-point rise to 88, respectively.
 Click on graph for larger image.
This graph show the NAHB index since Jan 1985.
This was close to the consensus forecast, and a strong reading.


