 RSS Feed
 by Calculated Risk on 9/23/2021 12:28:00 PM
Thursday, September 23, 2021
Fed's Flow of Funds: Household Net Worth Increased $5.9 Trillion in Q2
The Federal Reserve released the Q2 2021 Flow of Funds report today: Financial Accounts of the United States.
The net worth of households and nonprofits rose to $141.7 trillion during the second quarter of 2021. The value of directly and indirectly held corporate equities increased $3.5 trillion and the value of real estate increased $1.2 trillion.
...
Household debt increased 7.9 percent at an annual rate in the second quarter of 2021. Consumer credit grew at an annual rate of 8.6 percent, while mortgage debt (excluding charge-offs) grew at an annual rate of 8 percent.
 Click on graph for larger image.
The first graph shows Households and Nonprofit net worth as a percent of GDP.
With the sharp decline in GDP in Q2 2020, net worth as a percent of GDP increased sharply. This reversed somewhat in Q3 as GDP bounced back (even as net worth increased). But now net worth as a percent of GDP is at an all time high.
This includes real estate and financial assets (stocks, bonds, pension reserves, deposits, etc) net of liabilities (mostly mortgages). Note that this does NOT include public debt obligations.
 This graph shows homeowner percent equity since 1952.
Household percent equity (as measured by the Fed) collapsed when house prices fell sharply in 2007 and 2008.
In Q2 2021, household percent equity (of household real estate) was at 67.7% - up from 67.3% in Q1. This is the highest percent equity since the 1980s.
Note: about 30.3% of owner occupied households had no mortgage debt as of April 2010. So the approximately 50+ million households with mortgages have less than 67.7% equity - and about 1.2 million homeowners still have negative equity.
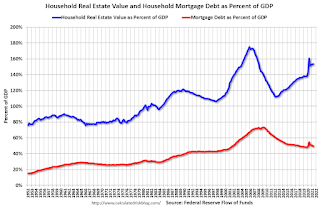 The third graph shows household real estate assets and mortgage debt as a percent of GDP. Note this graph was impacted by the sharp decline in Q2 2020 GDP.
Mortgage debt increased by $222 billion in Q2. This is the largest quarterly increase in mortgage debt since 2006.
Mortgage debt is up $573 billion from the peak during the housing bubble, but, as a percent of GDP is at 49.6% - down from Q1 - and down from a peak of 73.3% of GDP during the housing bubble.
The value of real estate, as a percent of GDP, increased in Q2, and is well above the average of the last 30 years.
 This graph shows homeowner percent equity since 1952.
 Household percent equity (as measured by the Fed) collapsed when house prices fell sharply in 2007 and 2008.
In Q2 2021, household percent equity (of household real estate) was at 67.7% - up from 67.3% in Q1. This is the highest percent equity since the 1980s.
Note: about 30.3% of owner occupied households had no mortgage debt as of April 2010. So the approximately 50+ million households with mortgages have less than 67.7% equity - and about 1.2 million homeowners still have negative equity.
 The third graph shows household real estate assets and mortgage debt as a percent of GDP. Note this graph was impacted by the sharp decline in Q2 2020 GDP.
Mortgage debt increased by $222 billion in Q2. This is the largest quarterly increase in mortgage debt since 2006.
Mortgage debt is up $573 billion from the peak during the housing bubble, but, as a percent of GDP is at 49.6% - down from Q1 - and down from a peak of 73.3% of GDP during the housing bubble.
The value of real estate, as a percent of GDP, increased in Q2, and is well above the average of the last 30 years.
CoreLogic: 1.2 Million Homes with Negative Equity in Q2 2021
by Calculated Risk on 9/23/2021 09:33:00 AM
From CoreLogic: Homeowners Gained $2.9 Trillion in Equity in Q2 2021, CoreLogic Reports
CoreLogic® ... today released the Homeowner Equity Report for the second quarter of 2021. The report shows U.S. homeowners with mortgages (which account for roughly 63% of all properties) have seen their equity increase by 29.3% year over year, representing a collective equity gain of over $2.9 trillion, and an average gain of $51,500 per borrower, since the second quarter of 2020.
...
“The growth in homeowner equity provides a strong financial cushion for tens of millions Americans. For those most impacted by the pandemic, equity gains will help play a critical role in staving off foreclosure,” said Frank Martell, president and CEO of CoreLogic. “Based on projected increases in economic activity and home values over the next year, we expect to see further gains in equity and a corresponding drop in negative equity, forbearance rates and foreclosure.”
...
Negative equity, also referred to as underwater or upside down mortgages, applies to borrowers who owe more on their mortgages than their homes are currently worth. As of the second quarter of 2021, negative equity share, and the quarter-over-quarter and year-over-year changes, were as follows:
• Quarterly change: From the first quarter of 2021 to the second quarter of 2021, the total number of mortgaged homes in negative equity decreased by 12% to 1.2 million homes, or 2.3% of all mortgaged properties.
• Annual change: In the second quarter of 2020, 1.8 million homes, or 3.3% of all mortgaged properties, were in negative equity. This number decreased by 30%, or 520,000 properties, in the second quarter of 2021.
• The national aggregate value of negative equity was approximately $268 billion at the end of the second quarter of 2021. This is down quarter over quarter by approximately $5.2 billion, or 1.9%, from $273.2 billion in the first quarter of 2021, and down year over year by approximately $18.9 billion, or 6.6%, from $286.8 billion in the second quarter of 2020.
emphasis added
 Click on graph for larger image.
This graph from CoreLogic compares Q2 to Q1 2021 equity distribution by LTV. There are a few properties with LTV over 125%. But most homeowners have a significant amount of equity. This is a very different picture than at the start of the housing bust when many homeowners had little equity.
On a year-over-year basis, the number of homeowners with negative equity has declined from 1.8 million to 1.2 million.
Weekly Initial Unemployment Claims increase to 351,000
by Calculated Risk on 9/23/2021 08:41:00 AM
The DOL reported:
In the week ending September 18, the advance figure for seasonally adjusted initial claims was 351,000, an increase of 16,000 from the previous week's revised level. The previous week's level was revised up by 3,000 from 332,000 to 335,000. The 4-week moving average was 335,750, a decrease of 750 from the previous week's revised average. The previous week's average was revised up by 750 from 335,750 to 336,500.The following graph shows the 4-week moving average of weekly claims since 1971.
emphasis added
 Click on graph for larger image.
The dashed line on the graph is the current 4-week average. The four-week average of weekly unemployment claims decreased to 335,750.
The previous week was revised up.
Regular state continued claims increased to 2,845,000 (SA) from 2,714,000 (SA) the previous week.
Note (released with a 2 week delay): There were an additional 4,896,125 receiving Pandemic Unemployment Assistance (PUA) that decreased from 5,487,233 the previous week (there are questions about these numbers). This was a special program for business owners, self-employed, independent contractors or gig workers not receiving other unemployment insurance. And threre were an additional 3,644,555 receiving Pandemic Emergency Unemployment Compensation (PEUC) down from 3,805,795.
Weekly claims were higher than the consensus forecast.
Wednesday, September 22, 2021
Thursday: Unemployment Claims, Q2 Flow of Funds
by Calculated Risk on 9/22/2021 09:00:00 PM
Thursday:
• At 8:30 AM ET, The initial weekly unemployment claims report will be released. The consensus is for 320 thousand initial claims, down from 332 thousand last week.
• Also at 8:30 AM, Chicago Fed National Activity Index for August. This is a composite index of other data.
• At 11:00 AM, the Kansas City Fed manufacturing survey for September.
• At 12:00 PM, Q2 Flow of Funds Accounts of the United States from the Federal Reserve.
September 22nd COVID-19: 7-Day Average New Cases Off 20% from Recent High
by Calculated Risk on 9/22/2021 06:14:00 PM
The CDC is the source for all data.
According to the CDC, on Vaccinations. Total doses administered: 387,493,716, as of a week ago 382,294,795, or 0.74 million doses per day.
| COVID Metrics | ||||
|---|---|---|---|---|
| Today | Week Ago | Goal | ||
| Percent fully Vaccinated | 54.9% | 54.1% | ≥70.0%1 | |
| Fully Vaccinated (millions) | 182.4 | 179.7 | ≥2321 | |
| New Cases per Day3 | 127,655 | 147,804 | ≤5,0002 | |
| Hospitalized3 | 82,870 | 91,282 | ≤3,0002 | |
| Deaths per Day3🚩 | 1,513 | 1,470 | ≤502 | |
| 1 Minimum to achieve "herd immunity" (estimated between 70% and 85%). 2my goals to stop daily posts, 37 day average for Cases, Currently Hospitalized, and Deaths 🚩 Increasing 7 day average week-over-week for Cases, Hospitalized, and Deaths ✅ Goal met. | ||||
IMPORTANT: For "herd immunity" most experts believe we need 70% to 85% of the total population fully vaccinated (or already had COVID).
KUDOS to the residents of the 12 states that have achieved 60% of total population fully vaccinated: Vermont at 69.1%, Massachusetts, Maine, Connecticut, Rhode Island, Maryland. New Jersey, Washington, New York, New Mexico, New Hampshire and Oregon at 60.1%.
The following 19 states and D.C. have between 50% and 59.9% fully vaccinated: Virginia at 59.8%, District of Columbia, Colorado, California, Minnesota, Hawaii, Delaware, Pennsylvania, Wisconsin, Florida, Nebraska, Iowa, Illinois, Michigan, South Dakota, Kentucky, Arizona, Kansas and Texas, and Nevada at 50.1%.
Next up (total population, fully vaccinated according to CDC) are Utah at 49.9%, Ohio at 49.7%, Alaska at 49.5%, North Carolina 48.9% and Montana at 48.0%.
 Click on graph for larger image.
This graph shows the daily (columns) and 7 day average (line) of positive tests reported.
Black Knight: National Mortgage Delinquency Rate Decreased in August
by Calculated Risk on 9/22/2021 04:34:00 PM
Note: At the beginning of the pandemic, the delinquency rate increased sharply (see table below). Loans in forbearance are counted as delinquent in this survey, but those loans are not reported as delinquent to the credit bureaus.
From Black Knight: Black Knight: With Moratoria Lifted, Foreclosure Starts Edge Higher, But Still 80% Below Pre-Pandemic Levels; Delinquency Rate Falls to 4% For First Time Since Early 2020
• The national delinquency rate on first lien mortgages fell to 4.00% in August, the lowest it’s been since pandemic-related impacts caused mortgage delinquencies to spike in early 2020According to Black Knight's First Look report, the percent of loans delinquent decreased 3.5% in August compared to July, and decreased 42% year-over-year.
• Serious delinquencies – including those in active forbearance – fell by 108,000 from July and, though down by more than 1 million from last August, are still roughly 930,000 above pre-pandemic levels
• August’s 7,100 foreclosure starts represented the largest such volume in eight months after foreclosure moratoria on federally backed loans were lifted at the end of July
• Despite the increase – which was driven primarily by restarting the process on loans that had been in foreclosure prior to the moratoria – start volumes remain 80% below August 2019 levels
• Though the number of loans in active foreclosure saw the first monthly rise of 2021 (+2,000), volumes remain near record lows and are still down 44% (-97,000) from pre-pandemic levels
• Prepayment activity rose by nearly 9% in the month with interest rates – which have held below 3% in recent months – continuing to spur both refinance and purchase activity
emphasis added
The percent of loans in the foreclosure process increased 1.7% in August and were down 24% over the last year.
Black Knight reported the U.S. mortgage delinquency rate (loans 30 or more days past due, but not in foreclosure) was 4.00% in August, down from 4.14% in July.
The percent of loans in the foreclosure process increased in August to 0.27%, from 0.26% in July.
The number of delinquent properties, but not in foreclosure, is down 1,557,000 properties year-over-year, and the number of properties in the foreclosure process is down 45,000 properties year-over-year.
| Black Knight: Percent Loans Delinquent and in Foreclosure Process | ||||
|---|---|---|---|---|
| Aug 2021 | July 2021 | Aug 2020 | Aug 2019 | |
| Delinquent | 4.00% | 4.14% | 6.88% | 3.45% |
| In Foreclosure | 0.27% | 0.26% | 0.35% | 0.48% |
| Number of properties: | ||||
| Number of properties that are delinquent, but not in foreclosure: | 2,122,000 | 2,206,000 | 3,679,000 | 1,818,000 |
| Number of properties in foreclosure pre-sale inventory: | 142,000 | 140,000 | 187,000 | 253,000 |
| Total Properties | 2,264,000 | 2,346,000 | 3,867,000 | 2,066,000 |
FOMC Projections and Press Conference
by Calculated Risk on 9/22/2021 02:11:00 PM
Statement here.
Fed Chair Powell press conference video here starting at 2:30 PM ET.
Here are the projections. In June, most participants expected around two rate hikes in 2023. Now, about half of participants expect one rates hike in 2022.
Wall Street forecasts were for GDP to increase at a 8.6% annual rate in Q2 (came in at 6.6%) and forecasts for Q3 have been downgraded recently.
So GDP was revised down for 2021.
1 Projections of change in real GDP and inflation are from the fourth quarter of the previous year to the fourth quarter of the year indicated.
The unemployment rate was at 5.2% in August.
| GDP projections of Federal Reserve Governors and Reserve Bank presidents, Change in Real GDP1 | ||||
|---|---|---|---|---|
| Projection Date | 2021 | 2022 | 2023 | 2024 |
| Sept 2021 | 5.8 to 6.0 | 3.4 to 4.5 | 2.2 to 2.5 | 2.0 to 2.2 |
| June 2021 | 6.8 to 7.3 | 2.8 to 3.8 | 2.0 to 2.5 | |
The unemployment rate was at 5.2% in August.
Note that the unemployment rate doesn't capture the economic damage to the labor market. Not only are there 2.7 million more people currently unemployed than prior to the pandemic, over 2.9 million people have left the labor force since February 2020. And millions more were being supported by various provisions of the disaster relief acts.
The unemployment rate was revised up slightly for 2021.
2 Projections for the unemployment rate are for the average civilian unemployment rate in the fourth quarter of the year indicated.
As of July 2021, PCE inflation was up 4.2% from July 2020.
The projections for inflation were revised up and the FOMC sees inflation solidly above target in 2021.
PCE core inflation was up 3.6% in July year-over-year.
Projections for core inflation were revised up.
The unemployment rate was revised up slightly for 2021.
| Unemployment projections of Federal Reserve Governors and Reserve Bank presidents, Unemployment Rate2 | ||||
|---|---|---|---|---|
| Projection Date | 2021 | 2022 | 2023 | 2024 |
| Sept 2021 | 4.6 to 4.8 | 3.6 to 4.0 | 3.3 to 3.7 | 3.3 to 3.6 |
| June 2021 | 4.4 to 4.8 | 3.5 to 4.0 | 3.2 to 3.8 | |
As of July 2021, PCE inflation was up 4.2% from July 2020.
The projections for inflation were revised up and the FOMC sees inflation solidly above target in 2021.
| Inflation projections of Federal Reserve Governors and Reserve Bank presidents, PCE Inflation1 | ||||
|---|---|---|---|---|
| Projection Date | 2021 | 2022 | 2023 | 2024 |
| Sept 2021 | 4.0 to 4.3 | 2.0 to 2.5 | 2.0 to 2.3 | 2.0 to 2.2 |
| June 2021 | 3.1 to 3.5 | 1.9 to 2.3 | 2.0 to 2.2 | |
PCE core inflation was up 3.6% in July year-over-year.
Projections for core inflation were revised up.
| Core Inflation projections of Federal Reserve Governors and Reserve Bank presidents, Core Inflation1 | ||||
|---|---|---|---|---|
| Projection Date | 2021 | 2022 | 2023 | 2024 |
| Sept 2021 | 3.6 to 3.8 | 2.0 to 2.5 | 2.0 to 2.3 | 2.0 to 2.2 |
| June 2021 | 2.9 to 3.1 | 1.9 to 2.3 | 2.0 to 2.2 | |
FOMC Statement: No Policy Change; Taper "May soon be warranted"
by Calculated Risk on 9/22/2021 02:04:00 PM
The Federal Reserve is committed to using its full range of tools to support the U.S. economy in this challenging time, thereby promoting its maximum employment and price stability goals.
With progress on vaccinations and strong policy support, indicators of economic activity and employment have continued to strengthen. The sectors most adversely affected by the pandemic have improved in recent months, but the rise in COVID-19 cases has slowed their recovery. Inflation is elevated, largely reflecting transitory factors. Overall financial conditions remain accommodative, in part reflecting policy measures to support the economy and the flow of credit to U.S. households and businesses.
The path of the economy continues to depend on the course of the virus. Progress on vaccinations will likely continue to reduce the effects of the public health crisis on the economy, but risks to the economic outlook remain.
The Committee seeks to achieve maximum employment and inflation at the rate of 2 percent over the longer run. With inflation having run persistently below this longer-run goal, the Committee will aim to achieve inflation moderately above 2 percent for some time so that inflation averages 2 percent over time and longer‑term inflation expectations remain well anchored at 2 percent. The Committee expects to maintain an accommodative stance of monetary policy until these outcomes are achieved. The Committee decided to keep the target range for the federal funds rate at 0 to 1/4 percent and expects it will be appropriate to maintain this target range until labor market conditions have reached levels consistent with the Committee's assessments of maximum employment and inflation has risen to 2 percent and is on track to moderately exceed 2 percent for some time. Last December, the Committee indicated that it would continue to increase its holdings of Treasury securities by at least $80 billion per month and of agency mortgage‑backed securities by at least $40 billion per month until substantial further progress has been made toward its maximum employment and price stability goals. Since then, the economy has made progress toward these goals. If progress continues broadly as expected, the Committee judges that a moderation in the pace of asset purchases may soon be warranted. These asset purchases help foster smooth market functioning and accommodative financial conditions, thereby supporting the flow of credit to households and businesses.
In assessing the appropriate stance of monetary policy, the Committee will continue to monitor the implications of incoming information for the economic outlook. The Committee would be prepared to adjust the stance of monetary policy as appropriate if risks emerge that could impede the attainment of the Committee's goals. The Committee's assessments will take into account a wide range of information, including readings on public health, labor market conditions, inflation pressures and inflation expectations, and financial and international developments.
Voting for the monetary policy action were Jerome H. Powell, Chair; John C. Williams, Vice Chair; Thomas I. Barkin; Raphael W. Bostic; Michelle W. Bowman; Lael Brainard; Richard H. Clarida; Mary C. Daly; Charles L. Evans; Randal K. Quarles; and Christopher J. Waller.
emphasis added
AIA: "Architecture billings continue to increase" in August
by Calculated Risk on 9/22/2021 12:14:00 PM
Note: This index is a leading indicator primarily for new Commercial Real Estate (CRE) investment.
From the AIA: Architecture billings continue to increase
The Architecture Billings Index (ABI) recorded its seventh consecutive positive month, according to a new report today from The American Institute of Architects (AIA).
The ABI score for August was 55.6, up from July’s score of 54.6. Any score above 50 indicates an increase in billings from the prior month. During August, scoring for both the new project inquiries and design contracts moderated slightly but remained in positive territory, posting scores of 64.7 and 56.6 respectively.
“The surge in design activity continued in August, signifying an expected upturn in construction activity in the fourth quarter and continuing into 2022,” said AIA Chief Economist, Kermit Baker, Hon. AIA, PhD. “This expected expansion will magnify the already serious problems of price inflation and availability of many construction products and materials, as well as the emerging labor shortages in the industry.”
...
• Regional averages: West (57.2); Midwest (55.2); South (52.5); Northeast (51.7)
• Sector index breakdown: mixed practice (56.0); commercial/industrial (54.7); institutional (54.4); multi-family residential (54.3)
emphasis added
 Click on graph for larger image.
This graph shows the Architecture Billings Index since 1996. The index was at 55.6 in August, up from 54.6 in July. Anything above 50 indicates expansion in demand for architects' services.
Note: This includes commercial and industrial facilities like hotels and office buildings, multi-family residential, as well as schools, hospitals and other institutions.
This index had been below 50 for eleven consecutive months, but has been solidly positive for the last seven months.
The eleven months of decline represented a significant decrease in design services, and suggests a decline in CRE investment through most of 2021 (This index usually leads CRE investment by 9 to 12 months), however we might see a pickup in CRE investment towards the end of the 2021 and into 2022.
Comments on August Existing Home Sales
by Calculated Risk on 9/22/2021 10:40:00 AM
In the Newsletter I have additional comments on August existing home sales.
This was the first month this year with sales down year-over-year. This should continue through the rest of the year, since sales averaged 6.6 million SAAR over the last four months of 2020.


